Week 0 (Community Bonding Period)
May 15 - May 20, 2025
Outcome
Ported three visualizations from the old Animint gallery to the new Animint2 gallery and submitted a pull request.
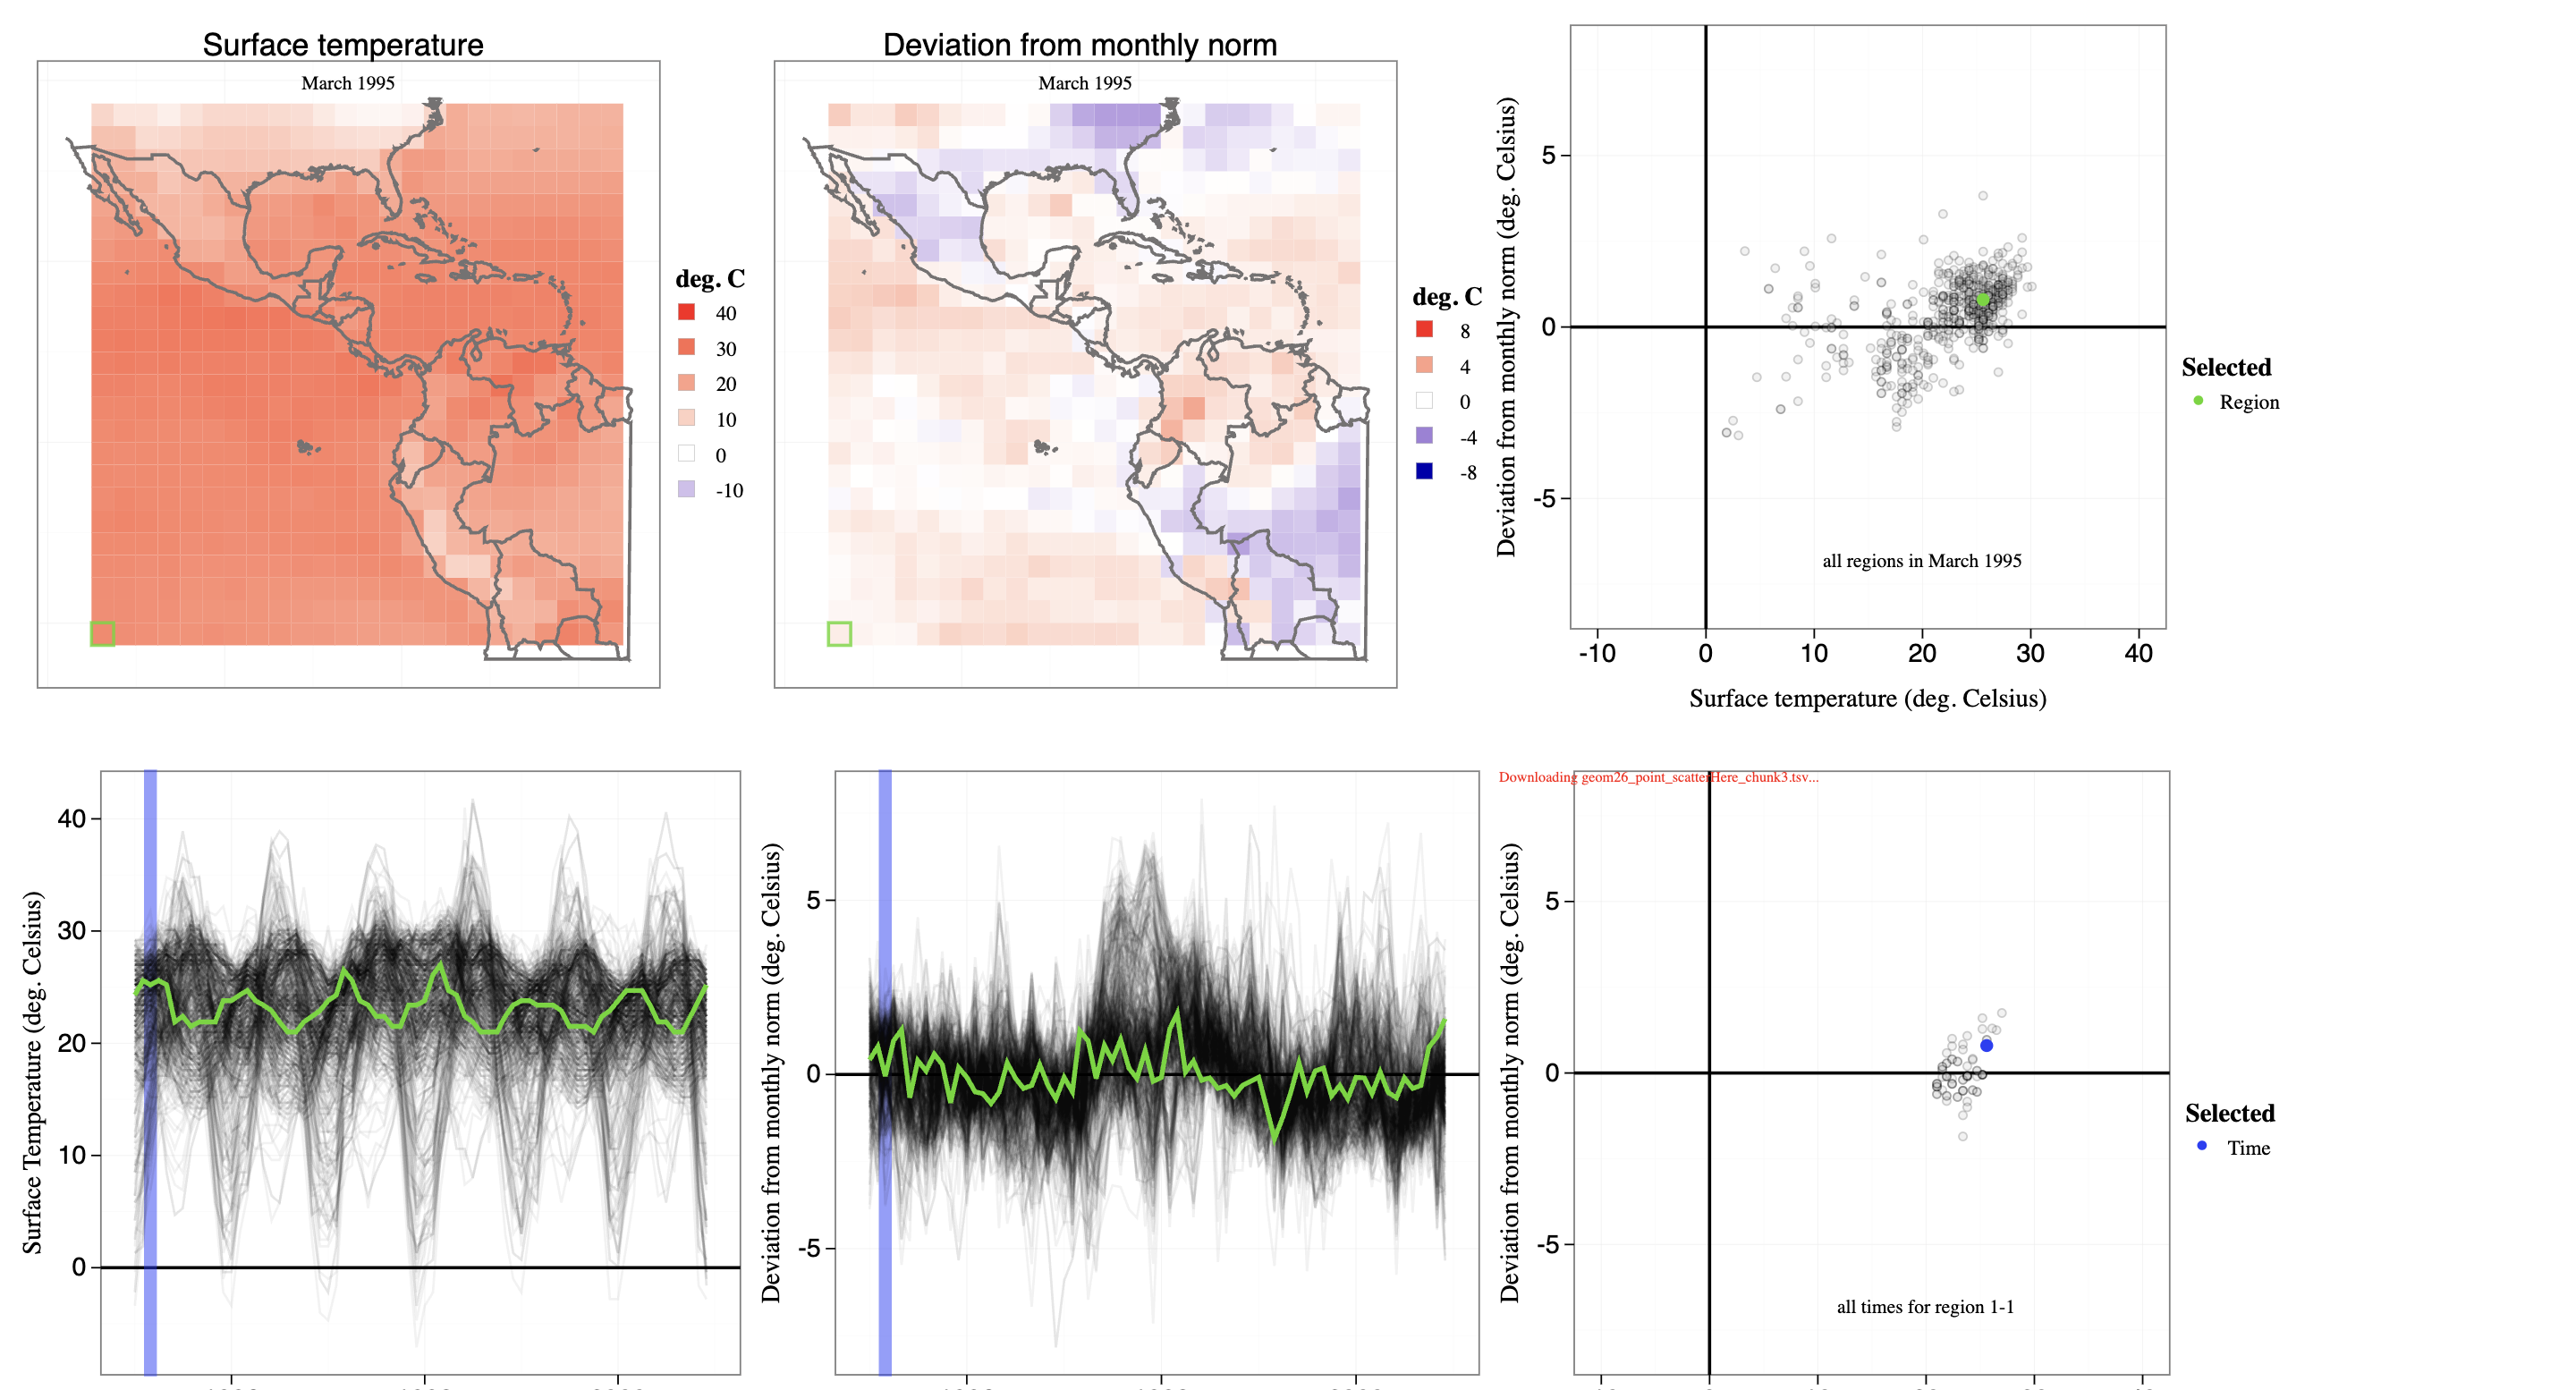
American Temperature Maps (#55)
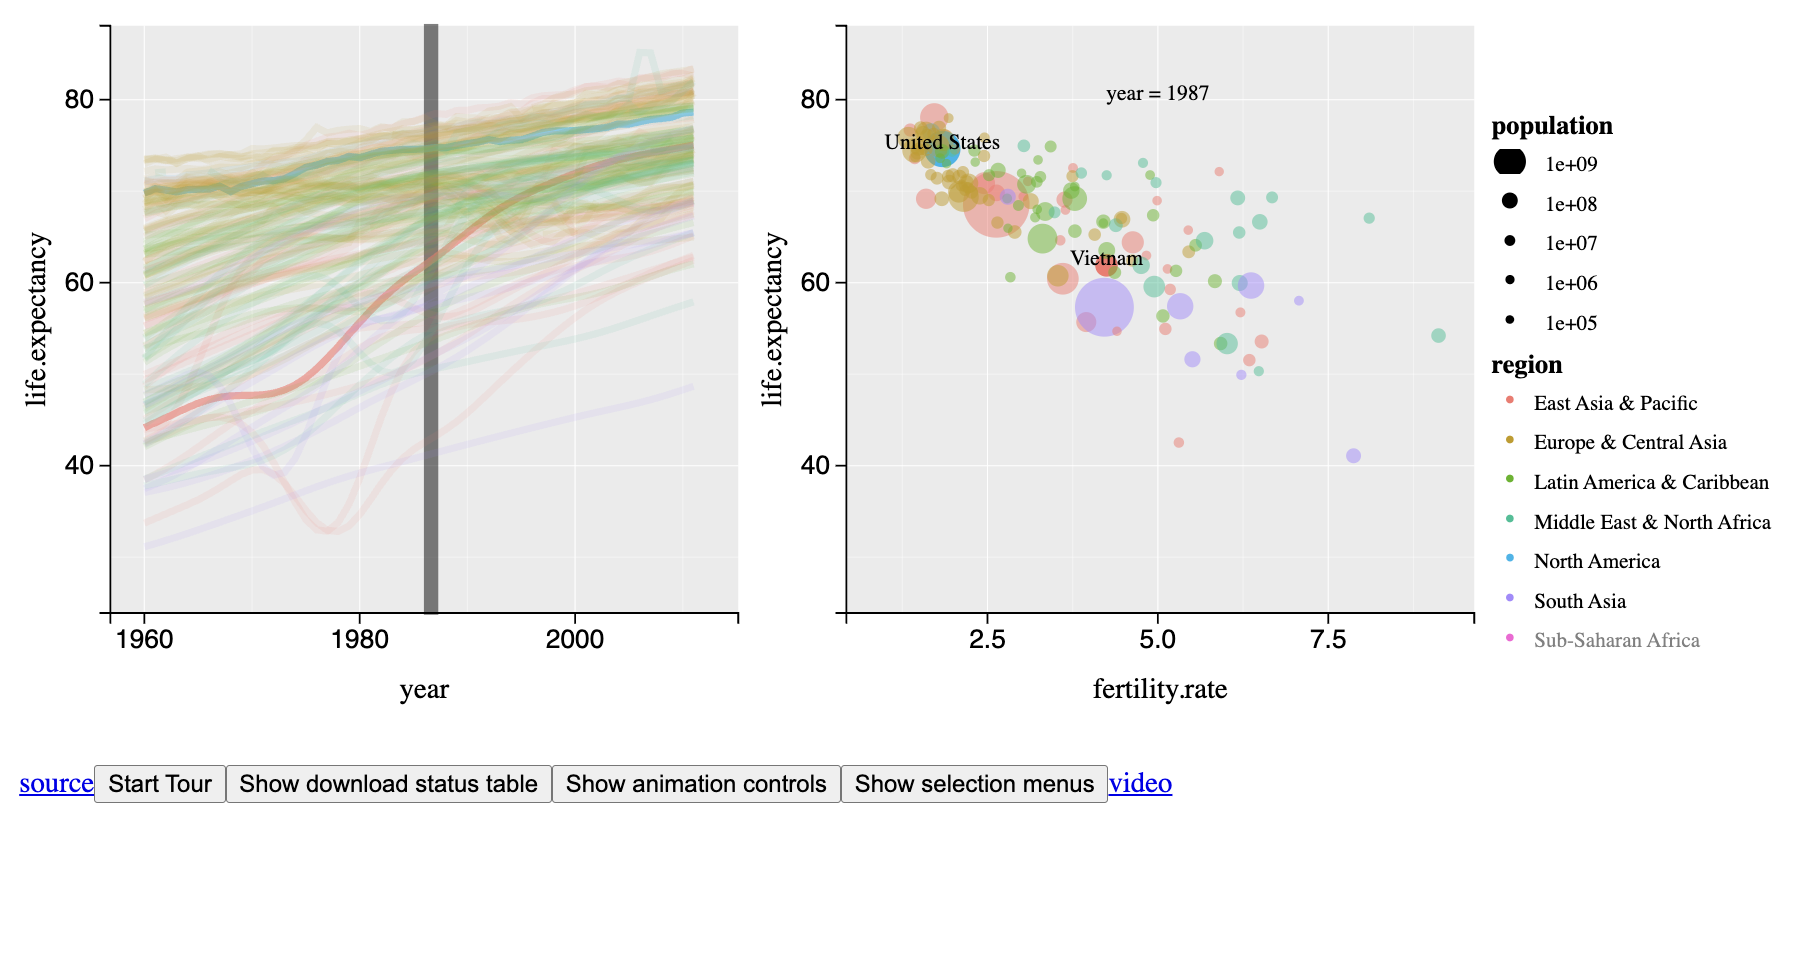
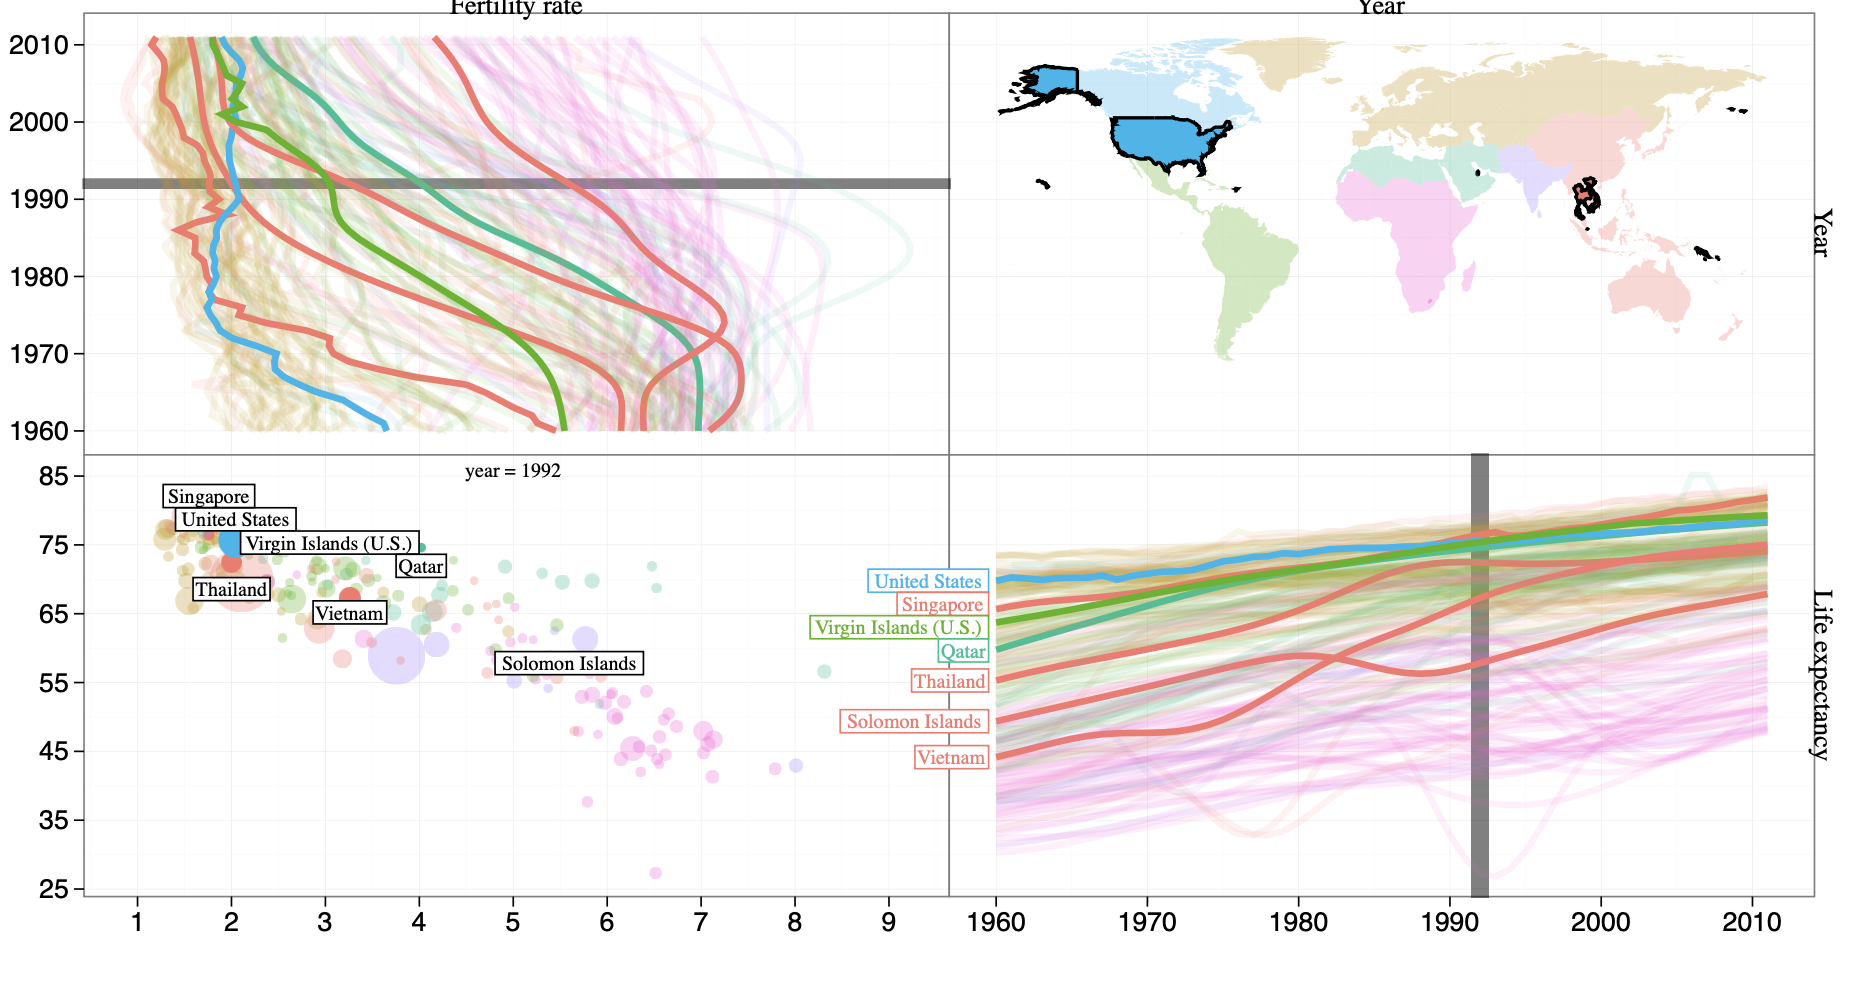
World Bank Paper (#41)
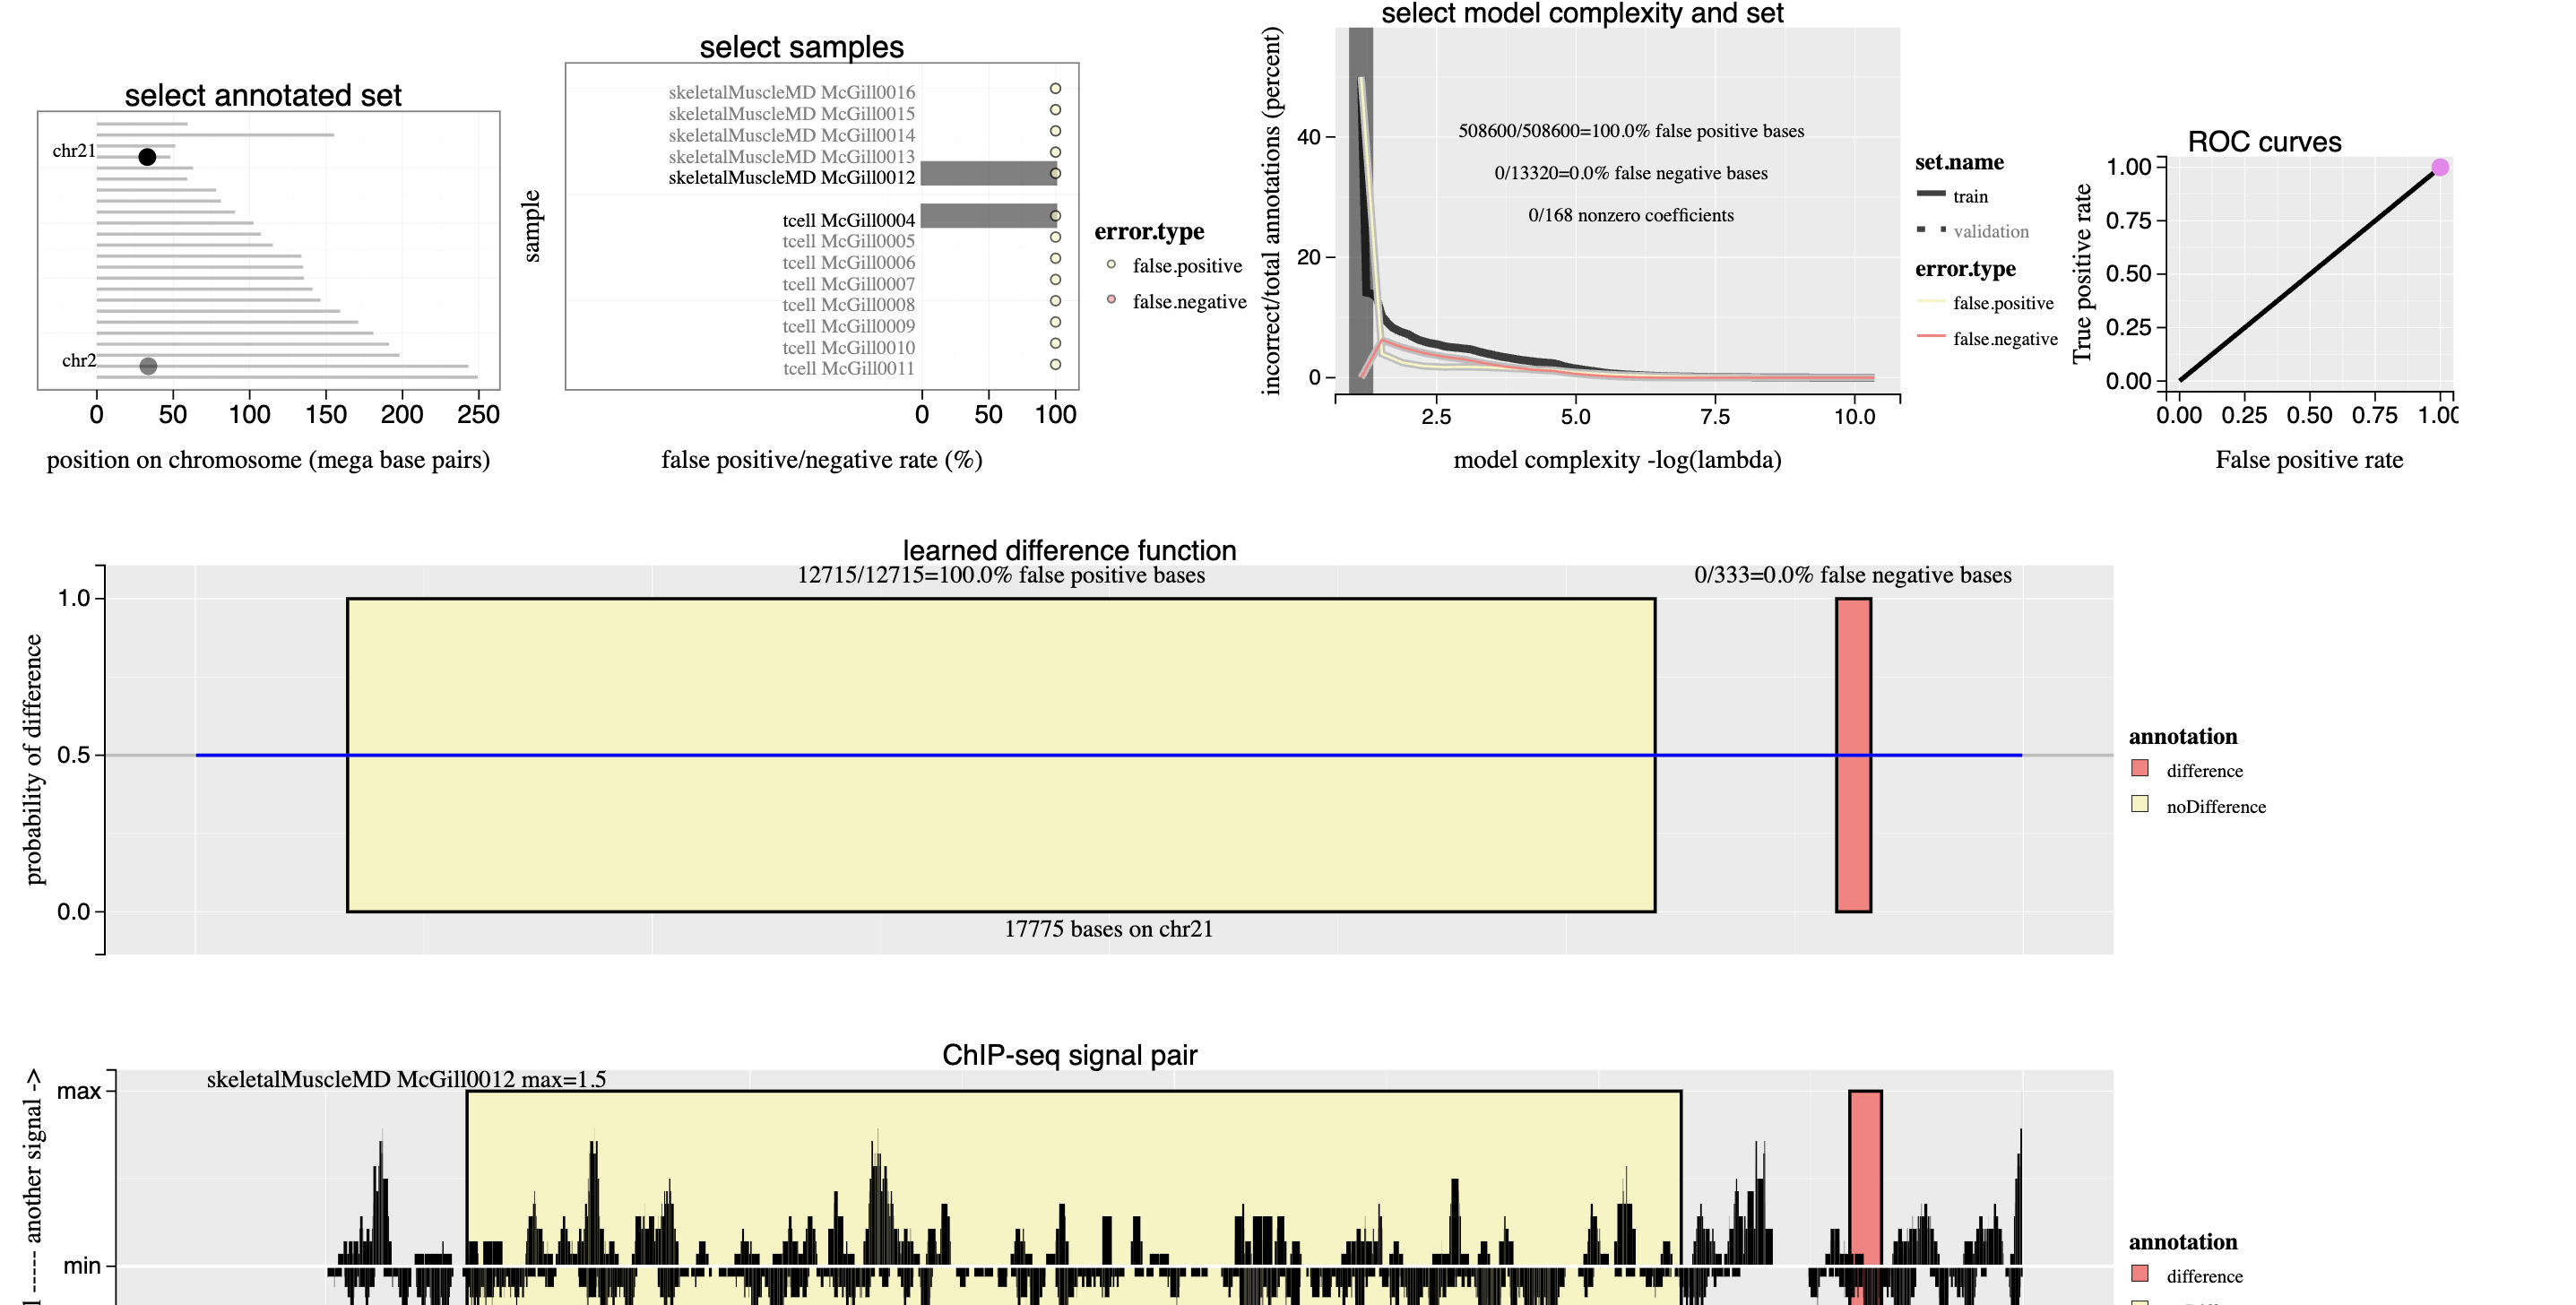
ChIP seq Data Unaligned (#35)
What I did
Due to ongoing exams, my time was limited, but I managed to:
- Port three key visualizations from the old gallery to the new Animint2 syntax:
#55- American Temperature Maps#41- World Bank paper visualization#35- ChIP seq data unaligned visualization
- Submitted
PR #29to the gallery repository - Fixed issues in the 41st and 35th visualizations
- Addressed mentor feedback on the 55th visualization
Learnings
This week was incredibly educational as I:
- Gained deep understanding of Animint functions and capabilities
- Learned the process of converting old Animint code to new Animint2 syntax
- Improved skills in making visualizations more clear, sophisticated and user-friendly
- Understood how to implement better interactivity in visualizations
- Learned to handle different types of geoms (points, tiles, lines) in Animint better
- Improved my understanding of the gallery structure and contribution process
- Explored different old visualization source codes and compiled a list of visualizations to be ported next
Confusions/Issues
Some challenges I encountered:
- Geom_tile transitions aren't smooth in the visualizations
- Need to investigate if this is a bug by creating a minimal reproducible example
- Need to check test cases to see if smooth transitions in geom_tile are properly tested
- Certain interactive elements required more work than expected to port properly
Next Week Targets
- Port other visualizations
- Complete remaining mentor suggestions on the 55th visualization
- Create demonstration videos once visualization outlooks are finalized
- Investigate the geom_tile transition issue
Links
Week 0 (Community Bonding Period)
May 21st - May 28th, 2025
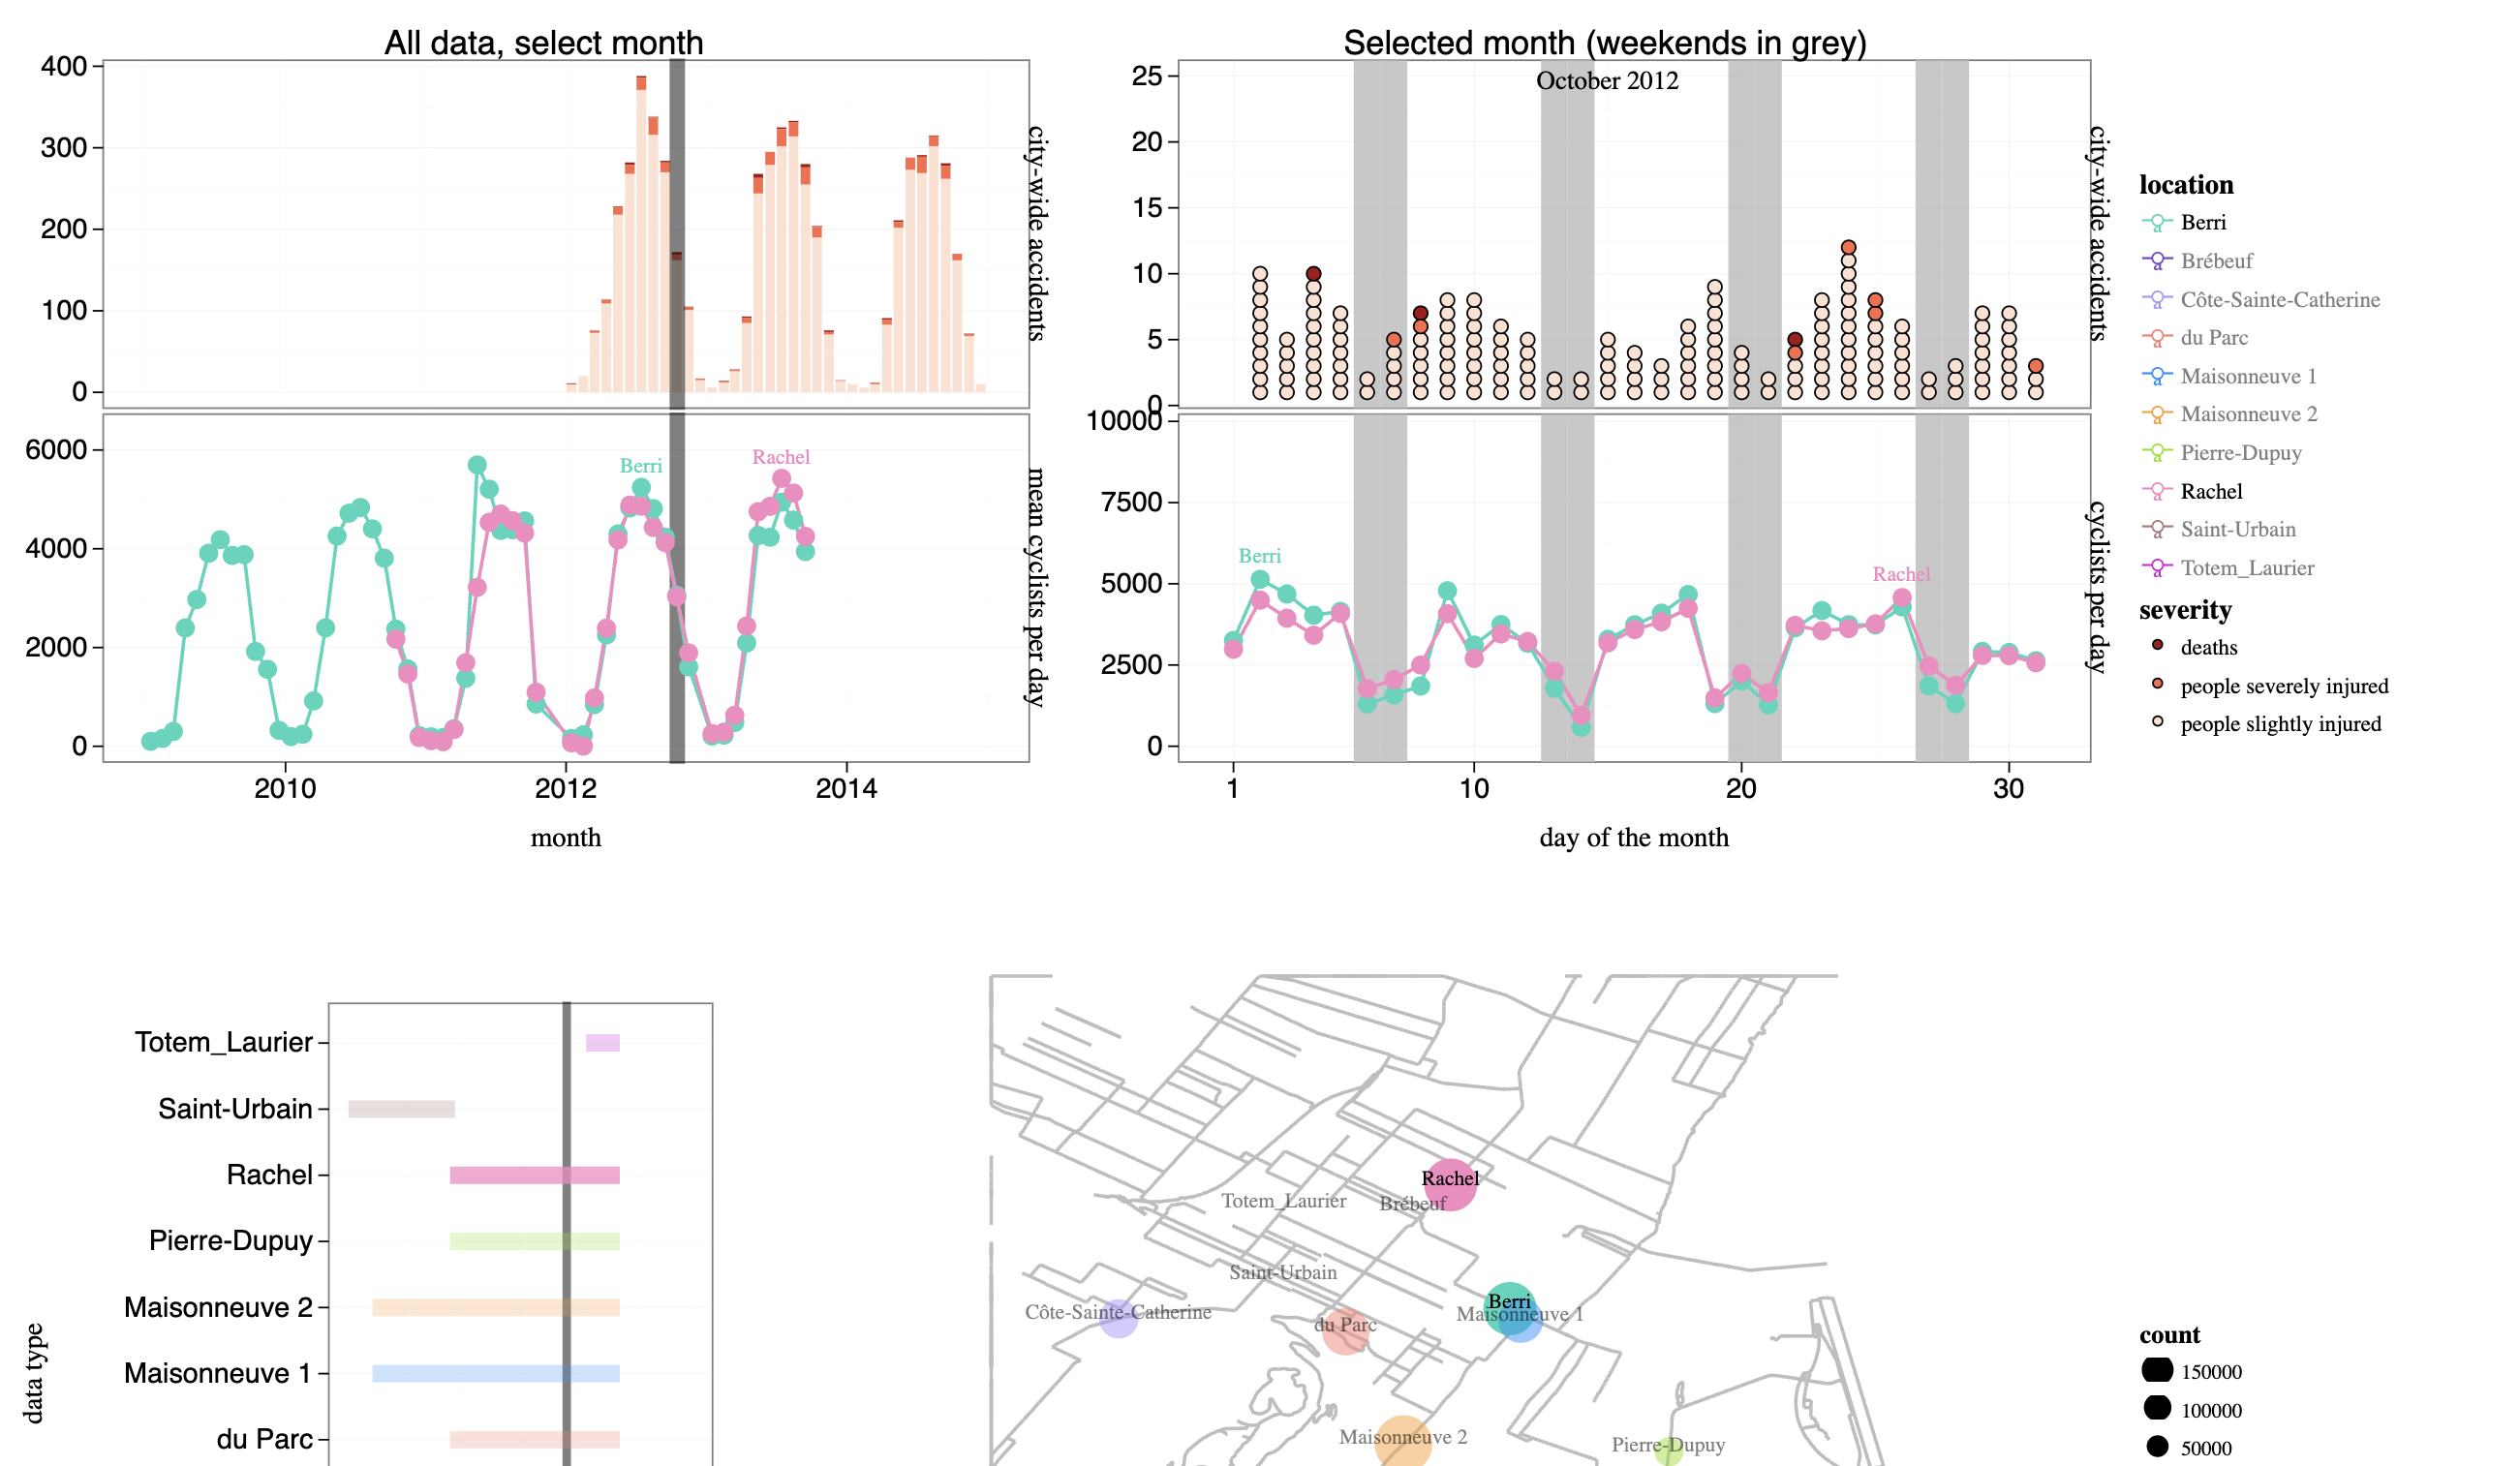
Montreal Bikes Jan 2016 (#43)
Demo of Constrained PDPA (#31)
Cost/slack minimization (#30)
Segmentation model selection with BIC (#50)
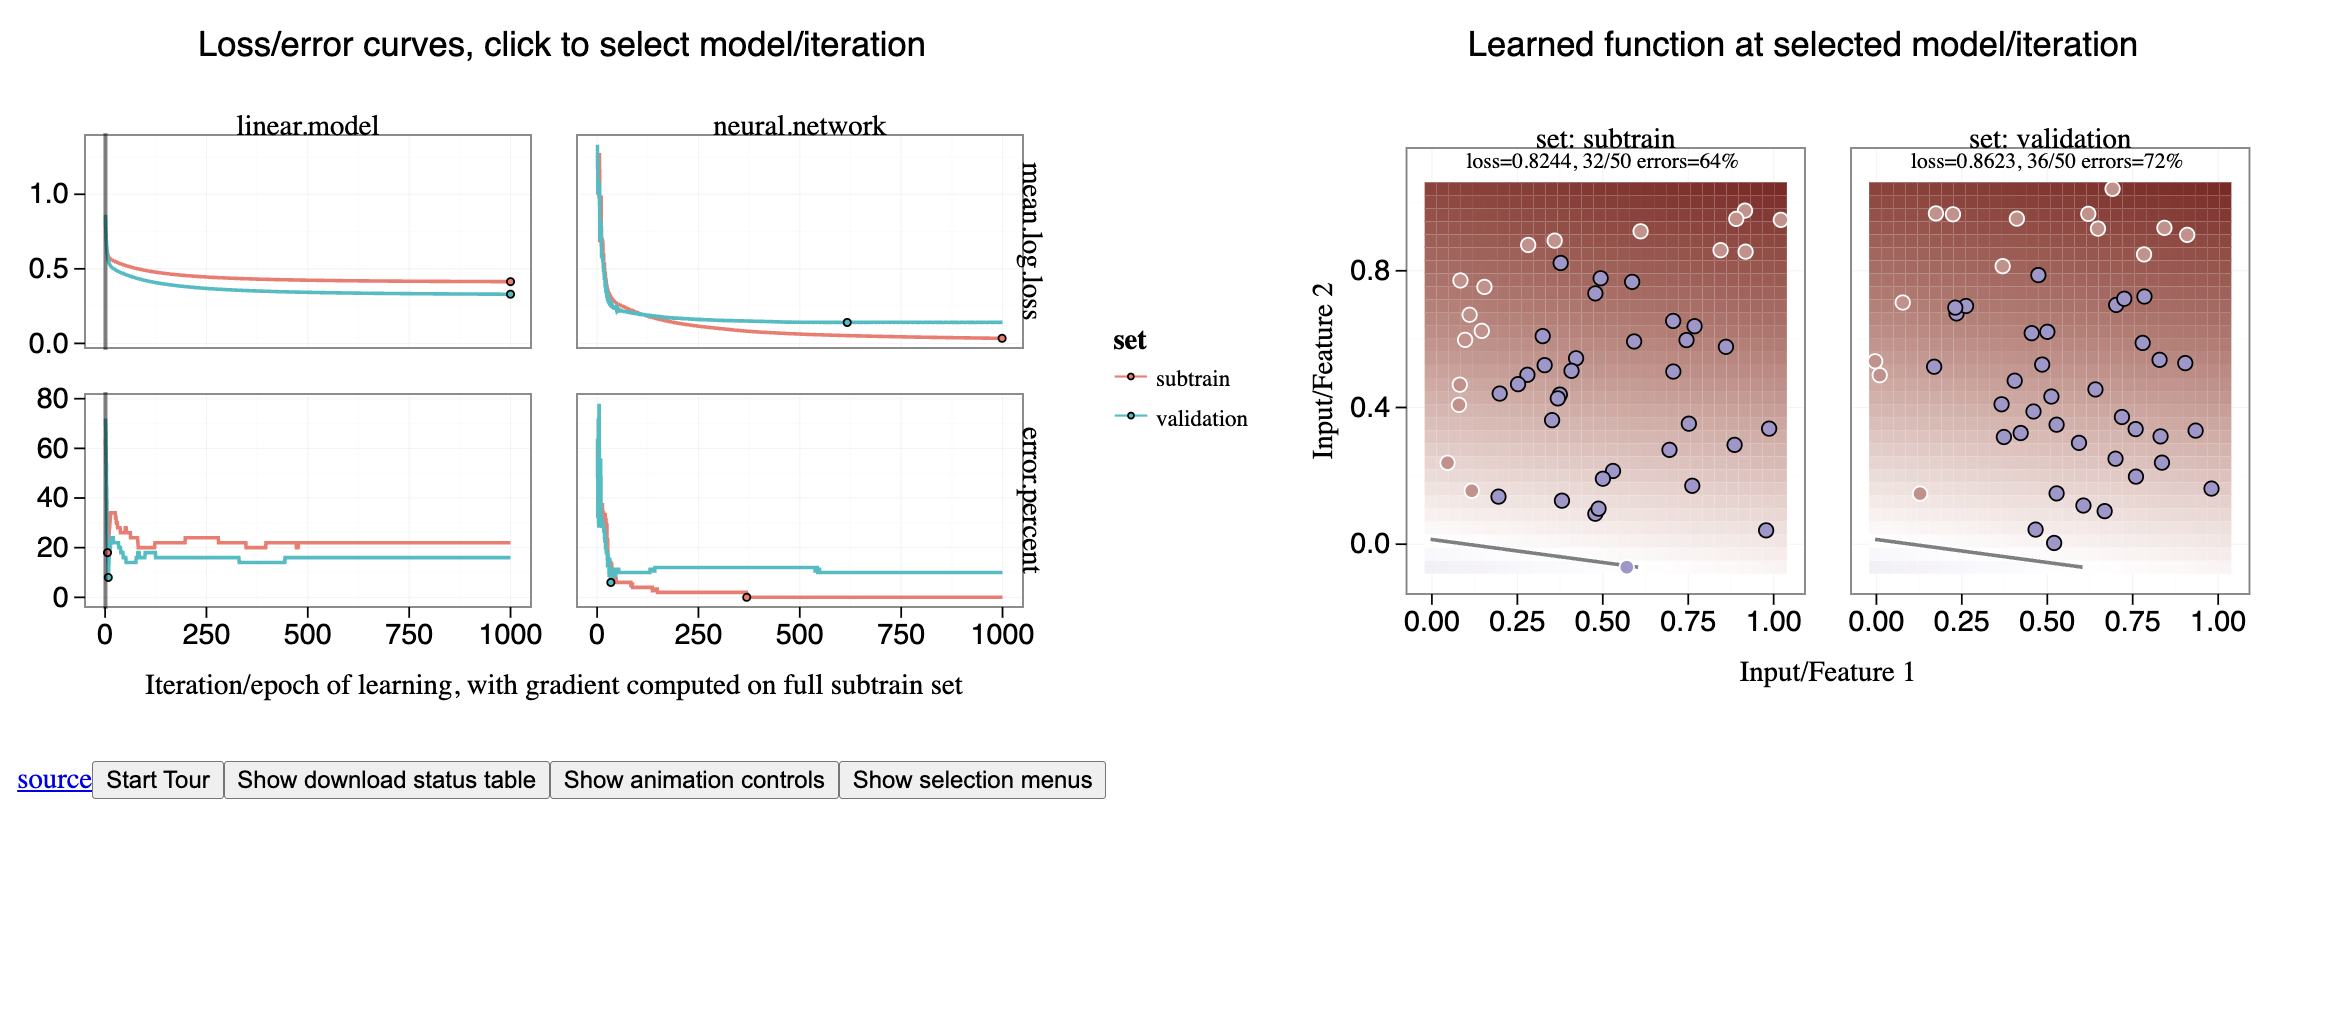
Gradient descent for neural networks (#5)
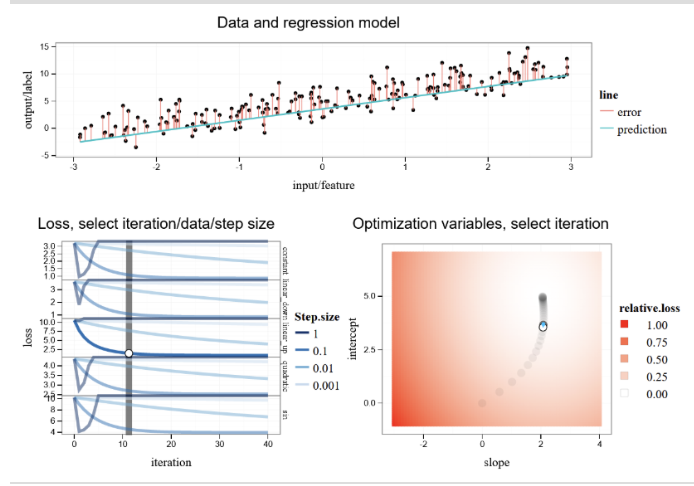
Gradient descent for regression (#6)
What I did
- Solved geom_tile transition issue
- Created comprehensive demonstration videos for all three previously ported visualizations
- Successfully got
PR #29merged into the main gallery repository - Ported six additional visualizations from old to new gallery:
#43- Montreal Bikes Jan 2016#31- Demo of Constrained PDPA#30- Cost/slack minimization over all feature thresholds#50- Segmentation model selection with BIC#5- Gradient descent for neural network and linear model#6- Gradient descent for regression
- Submitted and got
PR #30merged for these new visualizations - Ensured all visualizations maintained their original functionality while using Animint2 syntax
Learnings
- Solved geom_tile transition issue by implementing a two-layer approach: (documented in PR #29)
- Base layer for smooth transitions (
showSelected="time2") with fill colors but no borders - Selection layer for click interactions (
clickSelects="id") with border colors but no fill
- Base layer for smooth transitions (
- Data format requirements for different geoms
Confusions/Issues
- Initial uncertainty about the best approach to solve the geom_tile transition issue
- Some visualizations required significant restructuring to work with Animint2
- Ensuring consistent behavior across all browsers was occasionally challenging
Next Week Targets
- Investigate geom_abline bug (
#142) - Explore tooltips implementation
- Port remaining high-priority visualizations
Links
- Pull Request #30 (New visualizations)
- Merged PR #29 (Initial visualizations)
- Updated Animint2 Gallery
- Newly ported visualizations:
Week 0 (Community Bonding Period)
May 28th - June 1, 2025
Outcome
Investigated geom_abline bug and proposed solution, implemented new D3-based tooltip system.
D3-based Tooltip Implementation
Interactive tooltips following mouse position with D3 integration
What I did
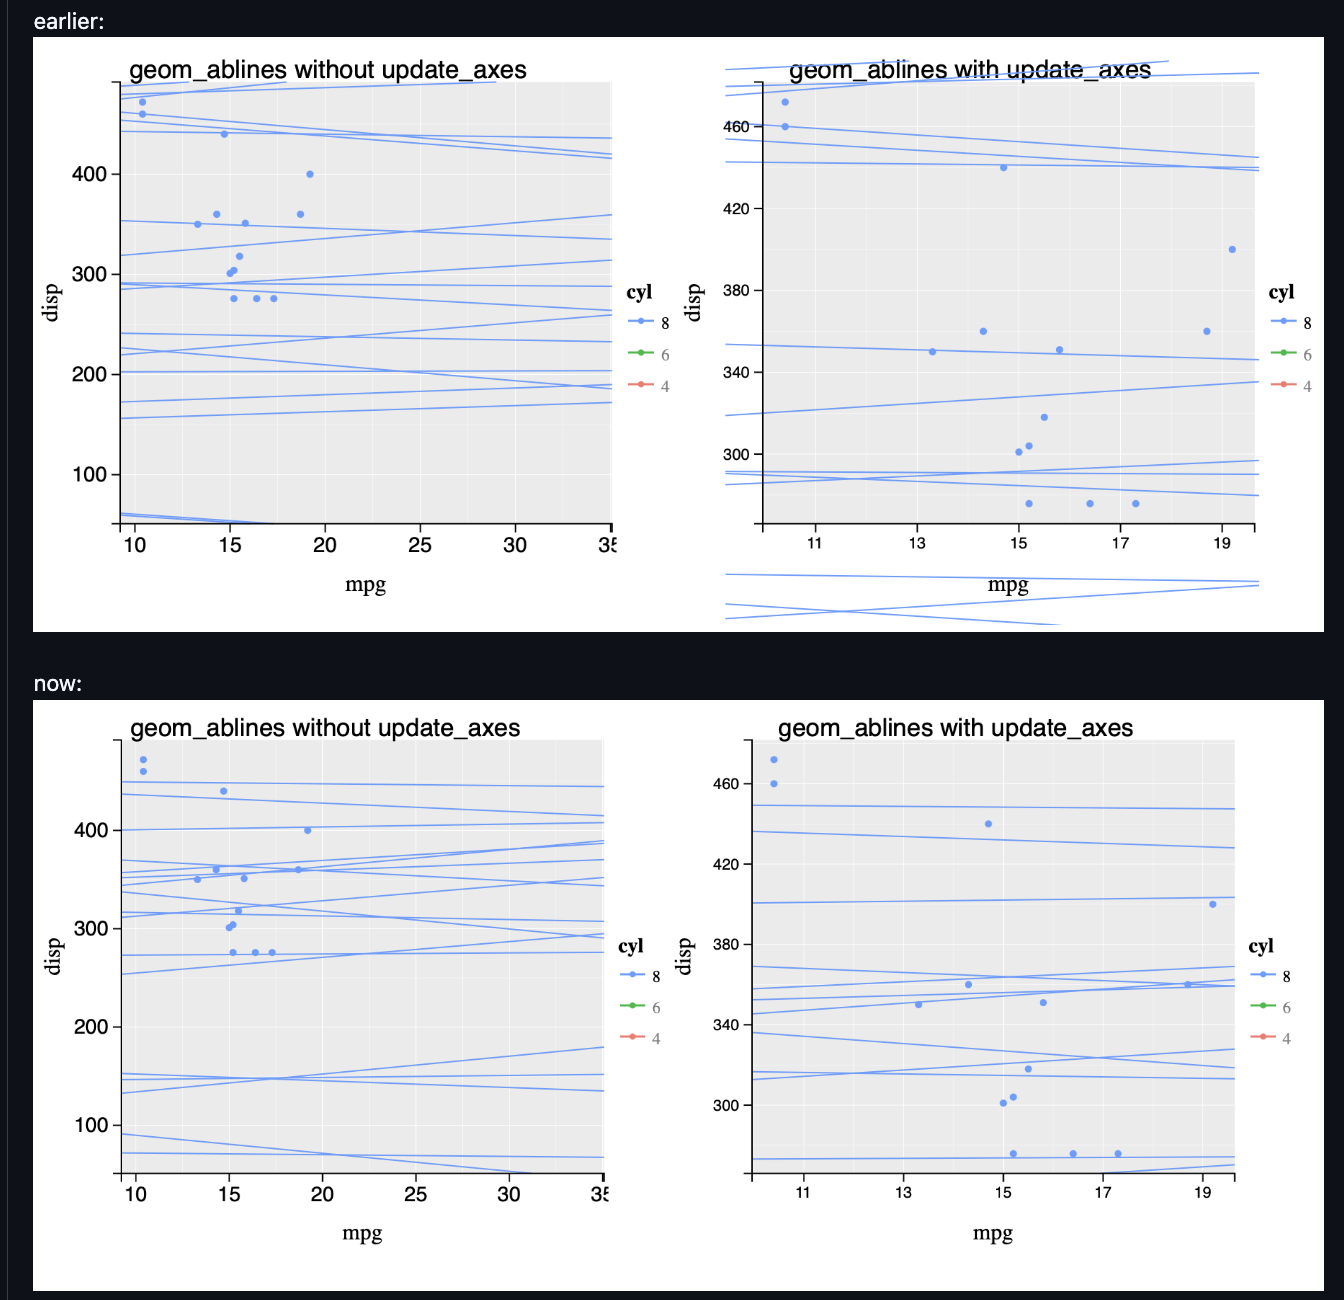
- Analyzed geom_abline boundary issue (
#142) with reproducible examples - Identified root cause: clipping not reapplied during
update_axes - Proposed JS solution to recalculate segments post-update
- Switched tooltip implementation from
tippy.jsto native D3 - Created unified tooltip div that follows mouse position
- Updated all tooltip tests for new implementation
Learnings
- geom_abline behavior:
- Initial clipping done by R's
pre_processfunction - Boundary constraints lost during scale updates
- Need to recalculate endpoints in JS using current scale domains
- Initial clipping done by R's
- Tooltip implementation:
- D3 outperforms
tippy.jsfor Animint's use case - Single dynamic div more efficient than multiple tooltips
- Better integration with existing D3 infrastructure
- D3 outperforms
- Renderer-compiler interaction during axis updates
- Test case requirements for renderer bugs
Confusions
- Still unsure about how to implement the js side function for clipping geom_ablines
- Facing some problems with the tests for tooltips in simulating hovering over the component - to get the exact position of the component on the viewport
Next Week Targets
- Create failing renderer test for geom_abline issue
- Implement JS solution for abline boundary clipping
- Finalize D3 tooltip PR (
#191) with test fixes - Get tooltip implementation merged
Links
Week 1
June 2 - June 8, 2025
Outcome
Refined tooltip PR with all requested changes, investigated geom_abline solutions, and implemented initial geom_aligned_boxes with quadratic programming optimization.
What I did
- Made all requested changes in tooltip PR, refining and improving minute details
- Investigated further into geom_abline issue and identified two potential approaches for handling clipping
- Opened new PR implementing
geom_aligned_boxes(#203) - a custom geom for aligned rectangular labels - Implemented the core structure where each box is a
<g class="geom">group containing both<rect>(box) and<text>(label) elements - Integrated quadprog.js (JavaScript port of R's quadprog library) for label positioning optimization
- Set up automatic text measurement system using browser's actual font metrics
- Created bounding rectangle calculation that dynamically sizes boxes to fit measured text
Learnings
- geom_abline clipping approaches:
- Option 1: Move clipping entirely to JS side, shifting pre_process function logic from R
- Option 2: Handle clipping in compiler side by modifying z_animint.js update_axes function
- Both approaches have trade-offs in terms of performance and code organization
- geom_aligned_boxes architecture and use case:
- Addresses the need for non-overlapping labels in visualizations, particularly useful for time series data where multiple category labels need to appear near data points
- Takes required aesthetics: x, y, label, plus optional ones like fill, color
- Mimics R's directlabels::last.polygons functionality but adapted for animint2's JavaScript environment
- Uses quadratic programming to optimize label positions: keeps x-positions fixed while adjusting y-positions to minimize overlaps
- Solver minimizes distance from original y-values while ensuring no label collisions
- Learned how different svg elements work. eg. we cant appened a
<text>in a<rect>element in svg! (which i was trying to do before for this implementation.
- Integration of quadprog.js JavaScript port for optimization
- Browser-based text sizing and bounding box calculations
- Browser-based text measurement is crucial since font rendering varies across systems
- Quadprog.js provides the mathematical optimization needed for clean label arrangement
- Dynamic bounding box calculation ensures labels are properly contained within their rectangles
- The optimization problem balances staying close to original positions vs avoiding overlaps
Confusions
- The quadratic programming solver integration isn't functioning correctly yet - the optimization constraints and objective function need refinement
- Need to implement proper error handling for cases where optimal positioning might not be feasible
- Still evaluating which approach would be best for the geom_abline clipping issue
- Debugging the quadprog.js parameter setup to ensure it correctly interprets the positioning constraints
Next Week Targets
- Complete geom_aligned_boxes implementation by fixing the quadprog solver integration
- Create comprehensive renderer tests for geom_aligned_boxes functionality
- Get tooltip PR (#191) merged after addressing any final feedback
- Implement robust error handling for edge cases in label positioning optimization
- Test geom_aligned_boxes with various data scenarios to ensure reliability
Links
Week 2
June 9 - June 15, 2025
Outcome
Completed core implementation of geom_aligned_boxes with optimized label positioning, fixed remaining tooltip issues, and got PR #191 merged.
geom_aligned_boxes interactive example
geom_aligned_boxes positioned in a way that they dont collide using quadprog.js
What I did
- Implemented quadratic programming solution for label positioning inspired by directlabels::qp.labels
- Created comprehensive renderer tests for geom_aligned_boxes covering:
- Basic rendering
- Collision avoidance
- Interactive behavior
- Boundary constraints
- Fixed final tooltip issues and got PR #191 merged
- Added multiple usage examples demonstrating different configurations
- Identified and documented edge cases:
- Text styling issues
- Plot boundary violations
- StyleActions conflicts
Learnings
- Finally cracked the label positioning! After digging through the directlabels source code, I got the quadratic programming approach working. It's cool how it:
- Handels overlaps and avoids collisions between labels using constraints in qp solver
- Uses a constraint matrix to prevent overlaps
- Minimizes the distance from original positions
- SVG structure headaches:
- Learned the hard way you can't nest text inside rect elements (facepalm)
- Had to completely restructure as <g> containing separate <rect> and <text>
- Still fighting with style inheritance - the geom group keeps grabbing styles when it shouldn't (for the geom_aligned_boxes that have ClickSelects in them)
- Testing adventures:
- Built tests for every weird edge case I could think of
- Found some sneaky bugs where labels would escape the plot area during interactions
- Learned to test performance with a lot of labels
- Tooltip victory lap:finally got the D3 tooltip PR merged!
Confusions/Issues
- Style inheritance problem:
- Added
if (g_info.geom == "aligned_boxes") return;to skip automatic styling - But clickSelects elements still get unwanted style attributes
- Can't figure out where the styles are leaking through
- Added
- Boundary issues:
- Labels near plot edges occasionally escape containment (only to a limited extent and only the left side of x limit)
- Need to add proper clipping
- Finalize geom_aligned_boxes styling implementation
- Begin investigating code coverage tools for animint2
- Prepare geom_aligned_boxes documentation
Next Week Targets
Links
Week 3
June 16 - June 22, 2025
Outcome
Refined geom_label_aligned implementation based on mentor feedback, began setting up code coverage tools, and ported additional visualizations to the gallery.
geom_label_aligned now with proper hjust alignment and optimized box sizing
What I did
- Implemented major improvements to geom_label_aligned based on mentor feedback:
- Changed default fill from black to white
- Fixed horizontal width calculation (no more extra space!)
- Added proper hjust support (0, 0.5, 1)
- Renamed from geom_aligned_boxes to geom_label_aligned
- Refactored test files into single comprehensive test:
- Created
check_aligned_box_collisionshelper function - Moved vertical alignment tests to WorldBank viz
- Consolidated all test cases
- Created
- Added detailed documentation about QP usage:
- Clarified it runs after showSelected filtering
- Explains vertical vs horizontal alignment modes
- Began implementing code coverage:
- Setting up V8 for JS coverage
- Configuring covr for R coverage
- Integrating with Codecov
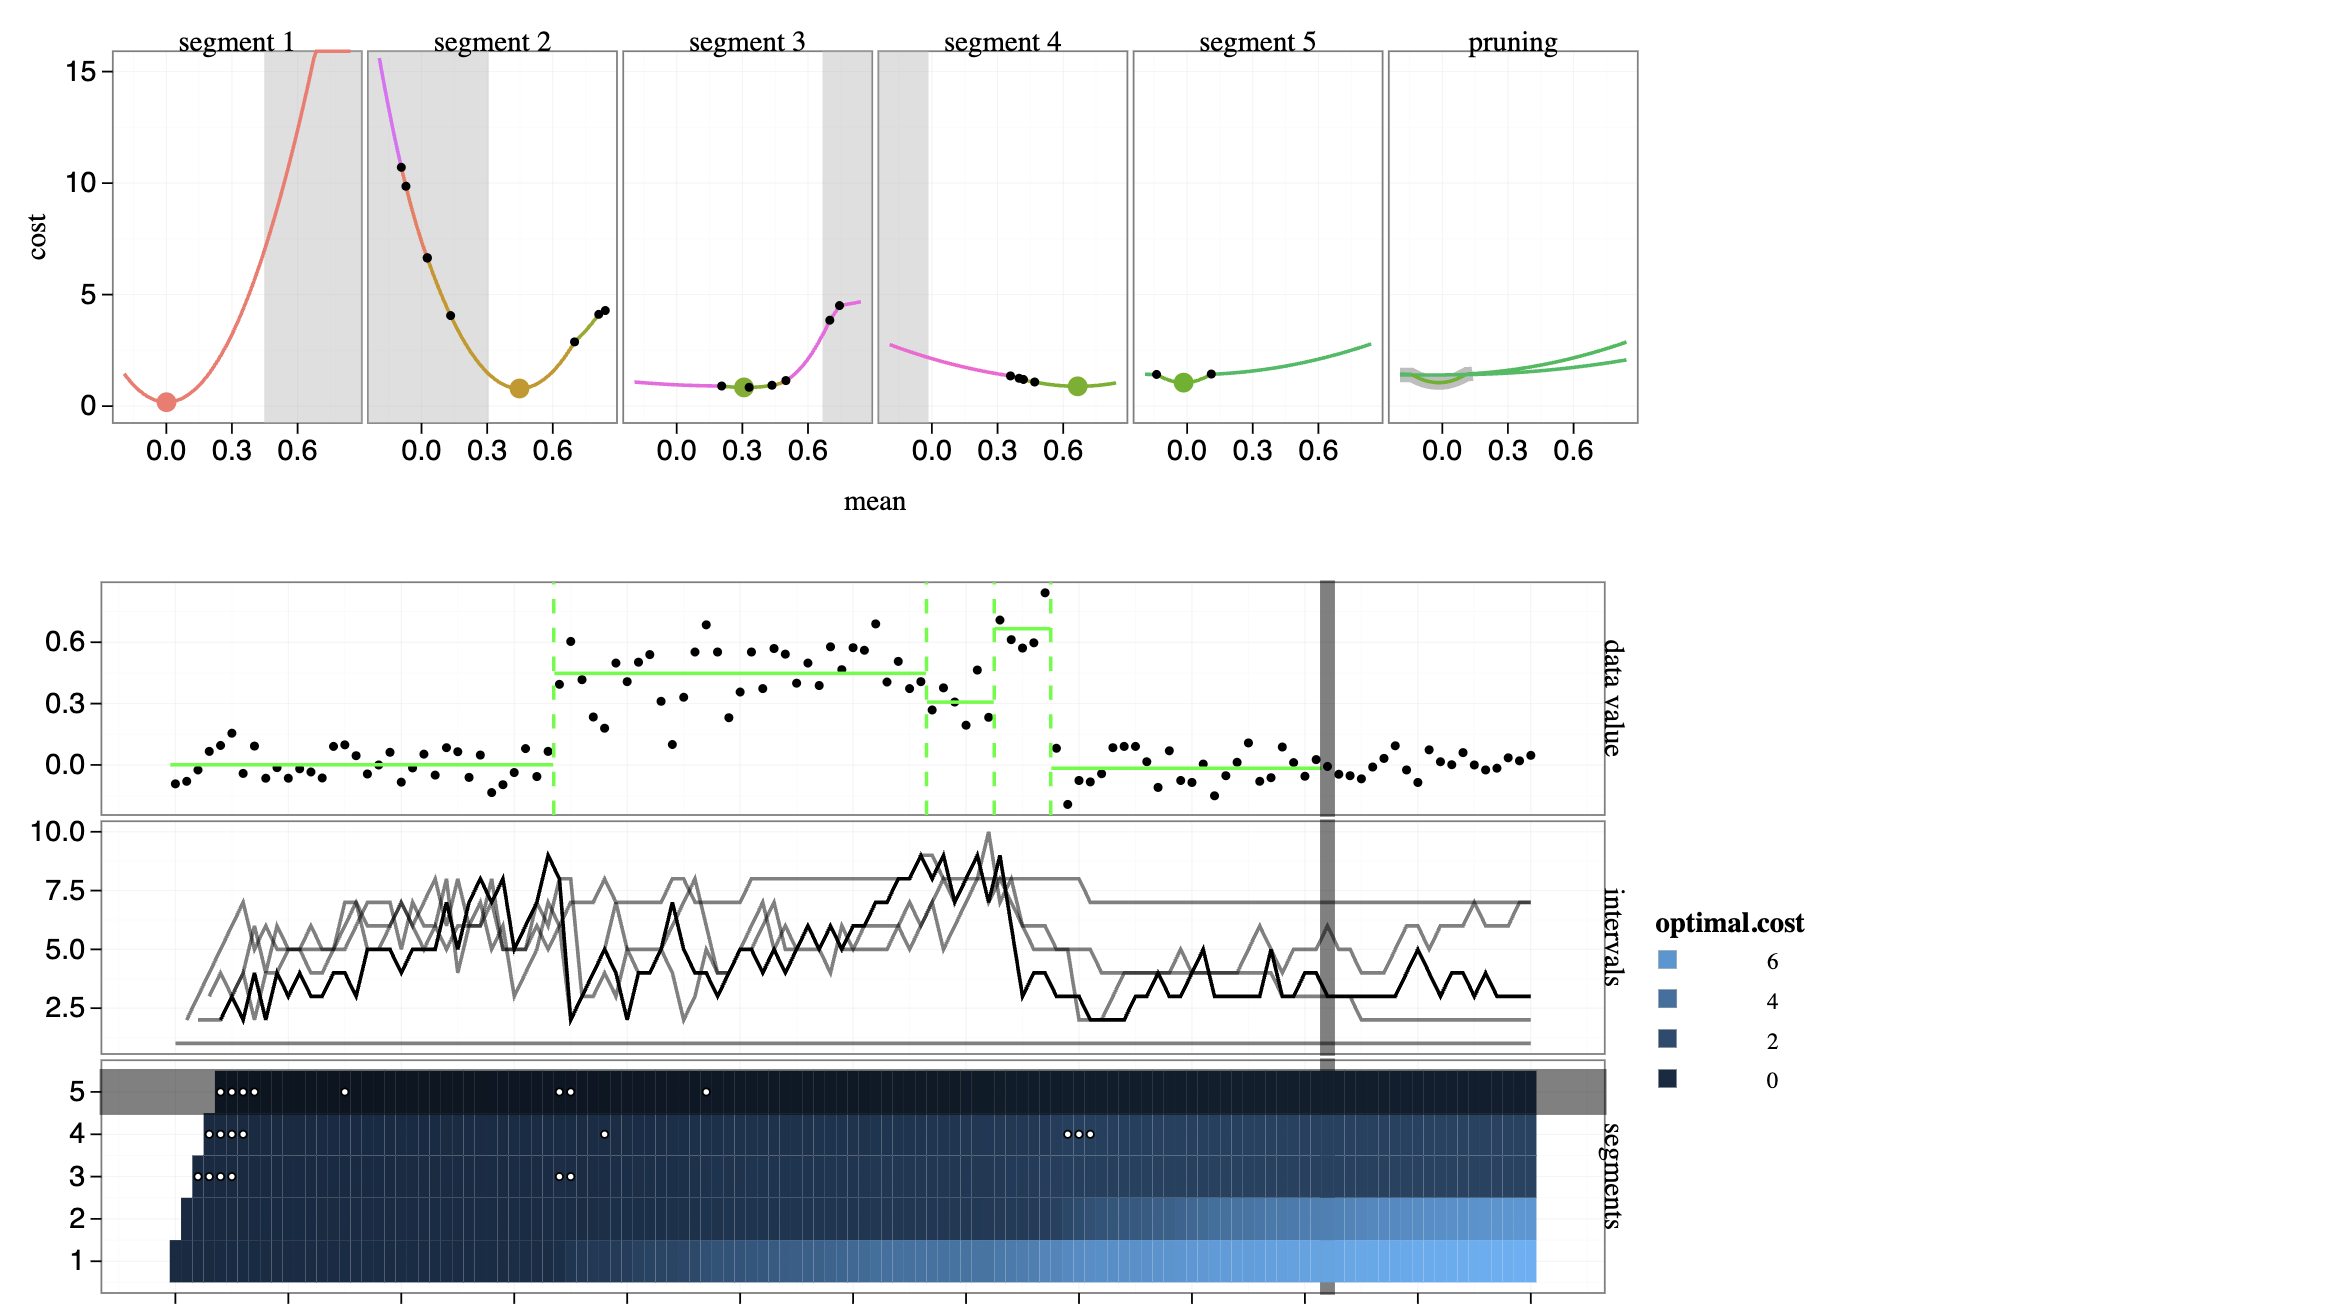
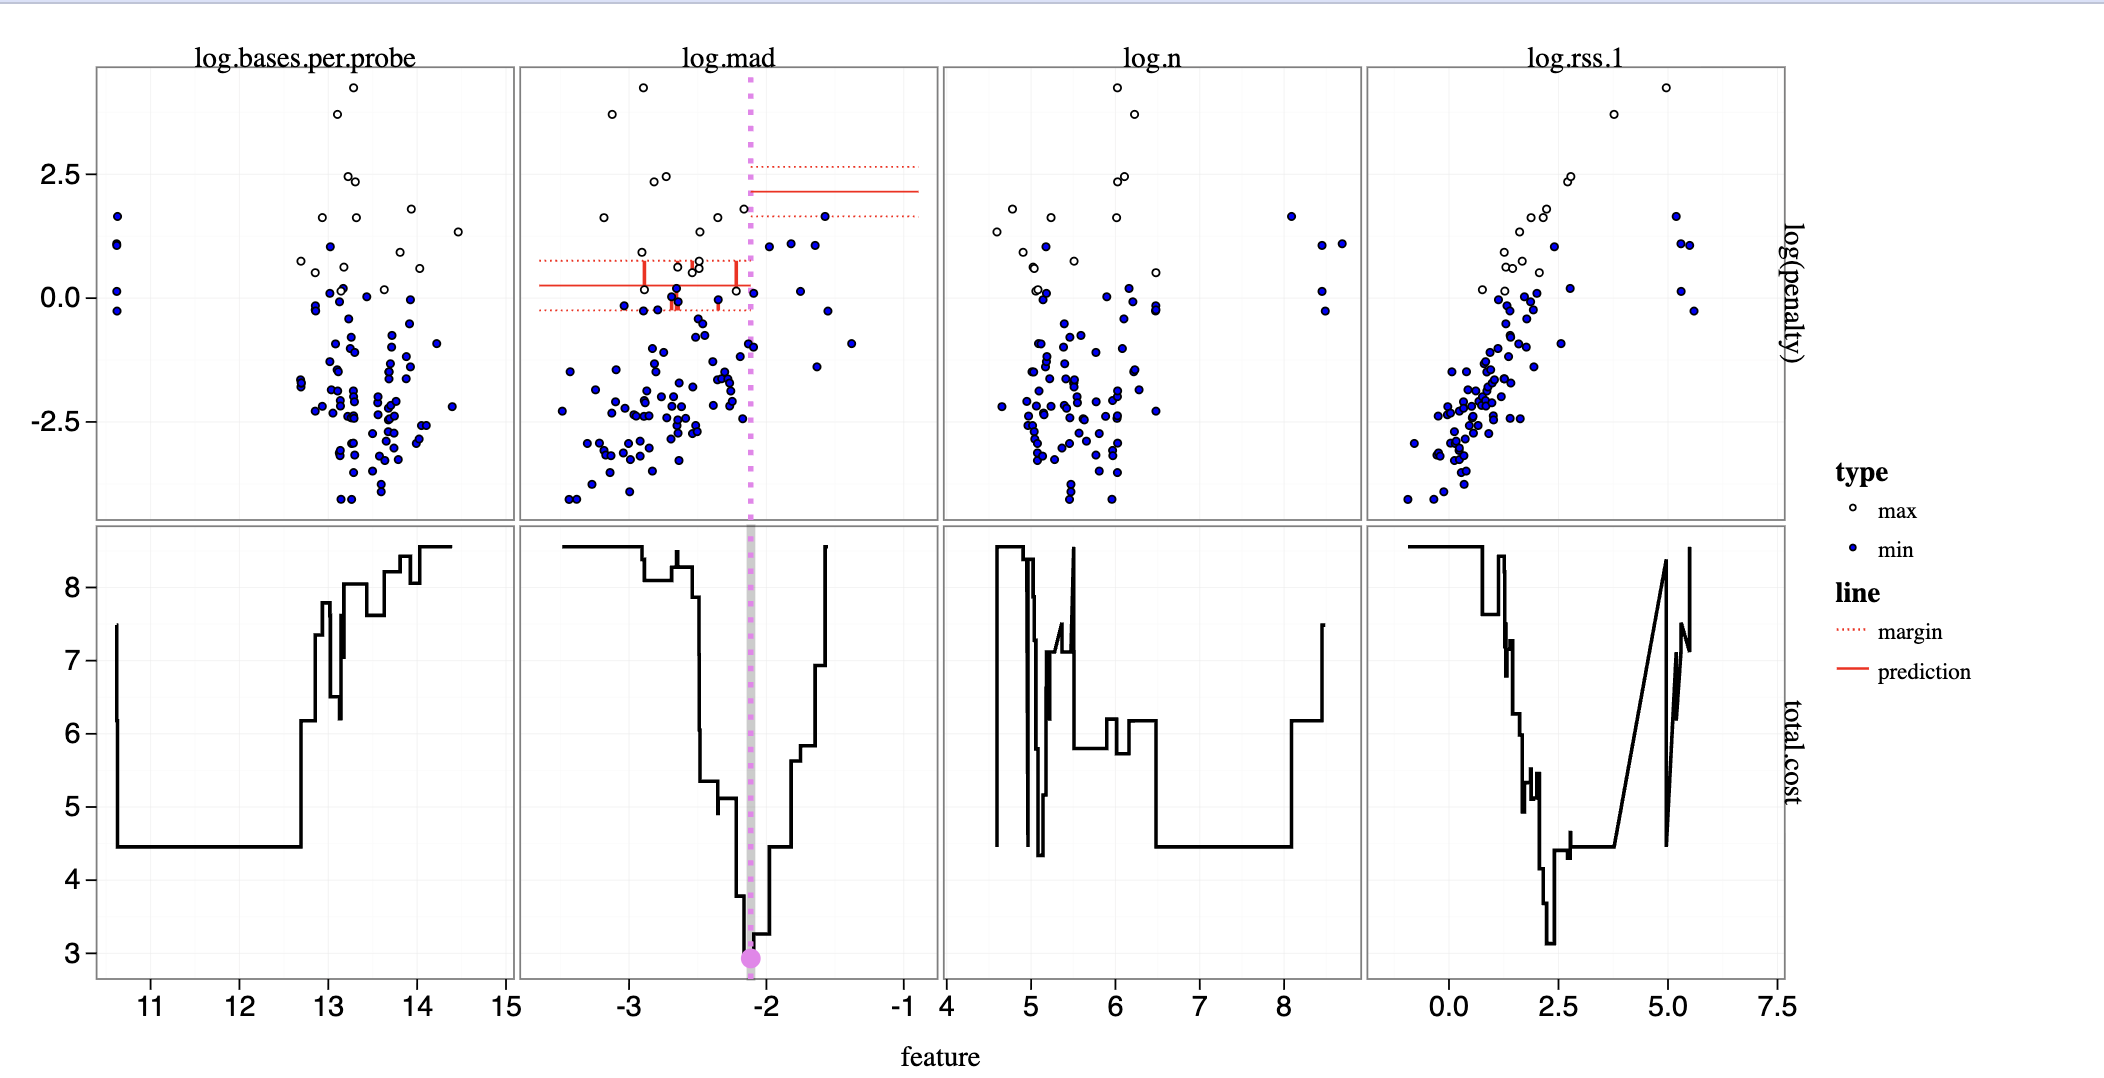
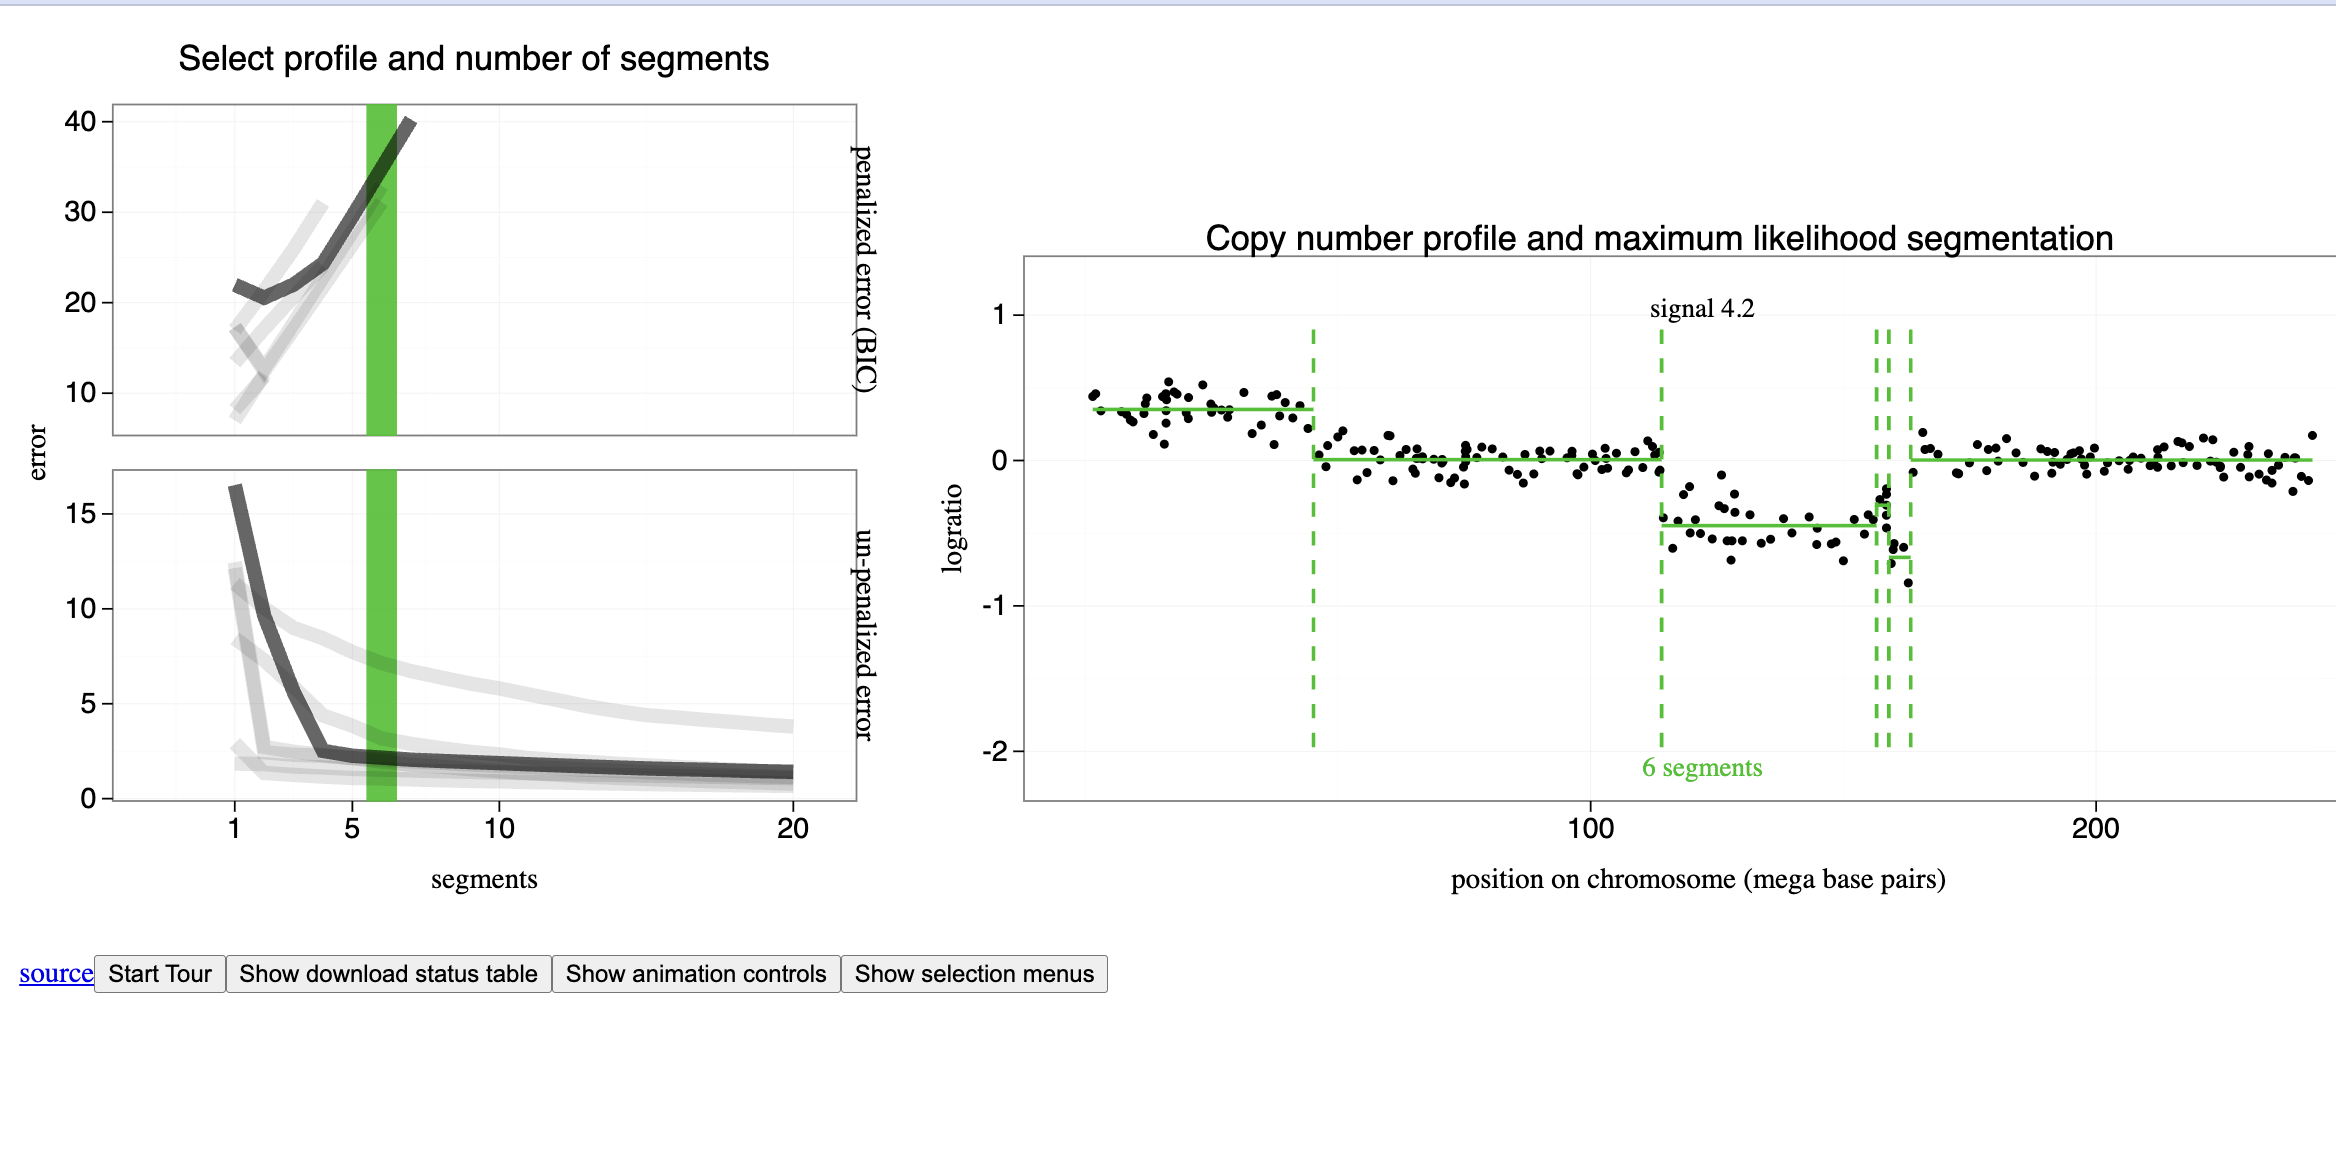
- Ported visualization #9/18 (Changepoint detection) to new gallery
Learnings
- Geom refinement lessons:
- Because of the unique structure of this geom, a lot of default styling structures implemented in animint2 for all geoms dont work for this one. So I had to implement some conditions in certain cases.
- Text alignment is trickier than expected (hjust wasn't working as intended). I had to implement a get_hjust function to get it working for the new geom.
- Naming conventions should match ggplot2 ecosystem
- Testing insights:
- DRY principle applies to tests too - helper functions are essential
- Real-world examples (like WorldBank) make great test cases
- Code coverage setup:
- V8 engine quirks when measuring JS coverage.
- How covr instruments R code
- Codecov report interpretation
Confusions/Issues
- QP behavior quirk:
- Labels with same x-values affect others even when not colliding
- Need to adjust constraint matrix to be smarter about this
- Code coverage challenges:
- Getting V8 to properly track JS execution paths
- Merging R and JS coverage reports
Next Week Targets
- Fix QP constraint matrix for non-colliding labels
- Complete initial code coverage implementation
- Finalize geom_label_aligned implementation and documentation
Links
Week 4 - When Labels Learned to Behave
June 23 - June 29, 2025
Watch how labels now stay politely within plot boundaries and shrink when needed (vertical alignment)
This Week's Progress
Finally cracked the label positioning challenges! My geom_label_aligned now handles crowded plots much more gracefully:
- Strict Plot Limits: No more label jailbreaks! Added firm constraints that keep all labels inside the plot area, no matter what.
- Smart Shrinking: When space gets tight, labels now automatically scale down (but stay readable) until everything fits. It's like watching polite commuters adjust in a crowded train!
- Group Optimization: Realized distant labels shouldn't affect each other, so I implemented proximity grouping before running the QP solver. Much faster and better results!
Horizontal alignment demo showing the same good behavior
Behind the Scenes
The shrinking mechanism was trickier than I expected. At first labels would shrink too much or not enough, but after several iterations I found the right balance. The key was:
- Calculate total space needed vs available
- Apply uniform shrinking for groups of labels close to each other and overlapping only when necessary
Also made progress on code coverage, though it's been a bumpy ride. Trying to merge R's covr with JS coverage from Chrome DevTools feels like teaching two pets to work together - they speak different languages!
Next Week Targets
Need to:
- Refine the geom_label_aligned PR if needed and get it merged
- Maybe adding some error points for geom_label_aligned like: "vjust cannot be used with vertical alignment" and vica-verca
- Finalize the coverage pipeline
- Write proper docs so others can use these features
Overall, super satisfying to see labels now handle tight spaces so elegantly. The videos really show how far we've come! Do watch it for better understand!
Week 5
June 30 - July 6, 2025
Outcome
Successfully integrated R and JavaScript code coverage reporting into the Animint2 CI pipeline. R coverage is now computed using covr and uploaded to Codecov, while JavaScript coverage is retrieved via Chrome DevTools and transformed into the Istanbul format using v8-to-istanbul. Combined reports now appear in the Codecov dashboard.
What I did
This week’s primary focus was code coverage infrastructure. I began with R coverage using the covr package. After setting up instrumentation, I updated the GitHub Actions workflow so that covr::package_coverage() runs after compiler tests, and the resulting coverage file is uploaded to Codecov using their bash uploader.
For JavaScript, I collected raw coverage data during renderer tests using Chrome DevTools Protocol’s JS coverage collector. This produced raw V8-format JSON coverage, but Codecov requires Istanbul JSON. To convert the raw format, I initially experimented with manually copying the v8-to-istanbul library into the repo and using only its lib-based source files, but this approach introduced maintenance complexity and unresolved dependency issues.
I pivoted to a cleaner solution by modifying the CI workflow to install Node modules specifically for the renderer test phase. This allowed me to install v8-to-istanbul via npm and use its CLI to convert the raw JSON into a Codecov-acceptable Istanbul JSON file. The Istanbul format includes mappings for statement, function, and branch coverage aligned to file paths, and is required for Codecov to properly visualize coverage across JS source files.
With this conversion step working reliably, I merged both R and JS coverage into the Codecov upload step. The Animint2 repository now generates unified code coverage reports from both languages. These reports are visible at:
https://app.codecov.io/github/animint/animint2
Learnings
I learned how to integrate heterogeneous coverage systems (R and JS) in a unified CI environment. Specifically for a unique structure like that of animint2, there was no coverage option available by default so had to make one using chrome devtools coverage collection for JS coverage. For R, covr integrates directly with the package test suite, but for JS, raw V8 coverage must be explicitly captured, stored, and transformed into the Istanbul schema.
Confusions/Issues
One issue raised was that the Codecov reports currently include files under the inst/htmljs/vendor/ directory, which are not part of our authored source code and shouldn’t be included in coverage statistics. I plan to add configuration to tell Codecov to ignore that path.
Another issue is with the CRAN test suite in the CI workflow. Currently, even when the CRAN check produces a WARNING,
the job exits with status 0 (green build). I need to update the GitHub Action so that any WARNING during R CMD check --as-cran results in a failed job (non-zero exit).
Next Week Targets
- Add ignore rules for vendor/ files in Codecov configuration.
- Update GitHub Actions so the CRAN test fails on WARNINGs.
- Begin polishing geom_label_aligned based on remaining issues from mentor review.
Links
Week 6
July 7 - July 13, 2025
Outcome
All major coverage-related issues were resolved and the PR was successfully merged. Animint2 now supports unified R + JavaScript code coverage reporting through Codecov, with comment summaries and file-level insights available for every commit and pull request. I also implemented smooth transitions for geom_label_aligned, added user-level control to hide label background rectangles, and began refining the grouping logic used in label position optimization.
Smooth transitions added for geom_label_aligned
What I did
I wrapped up and merged the code coverage implementation. Codecov now posts automated comments on all PRs and commit pushes, showing exactly which lines are covered and which aren't. This dramatically improves review visibility and helps prioritize test improvements. Coverage is uploaded after CI runs for both R (via covr) and JavaScript (via v8-to-istanbul), and can be browsed at:
https://app.codecov.io/github/animint/animint2.
I also resolved the issue where CRAN tests with NOTEs or WARNINGs were still passing (green build). The GitHub Actions workflow now correctly fails when any CRAN check emits a NOTE or WARNING, ensuring stricter CI validation.
On the graphics side, I implemented smooth transitions for geom_label_aligned. Previously, transitions weren’t working as expected due to its unique SVG structure — specifically, each label consisted of a <g class="geom"> with both <rect> and <text> inside. Unlike other geoms, these child elements weren’t receiving the transition logic. I updated the renderer logic in animint.js to explicitly apply transitions to these nested SVG elements within the geom_label_aligned block. This now enables smooth animations on reposition and re-render.
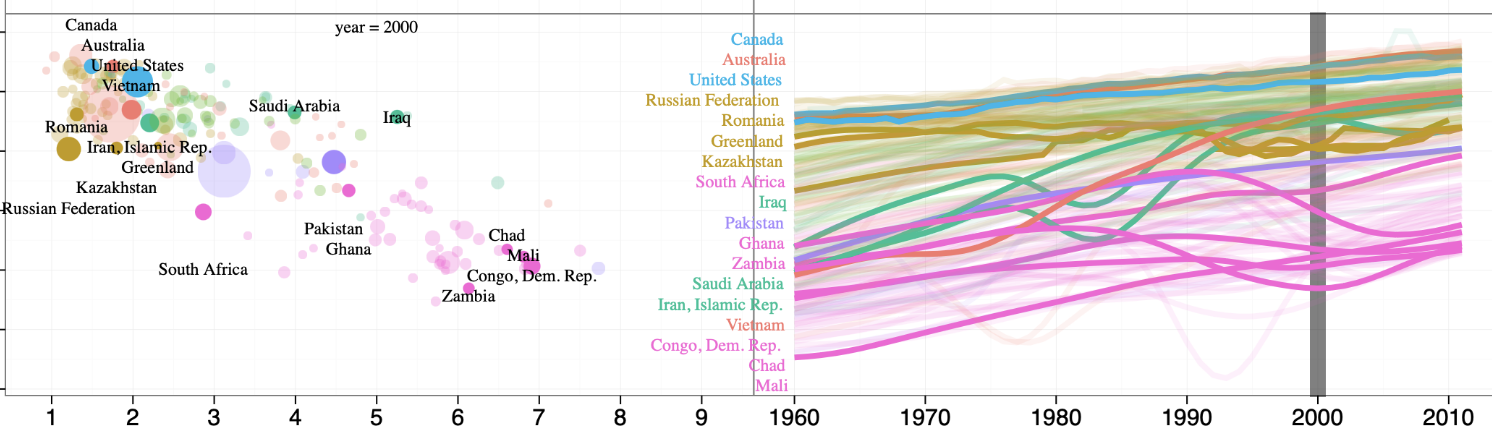
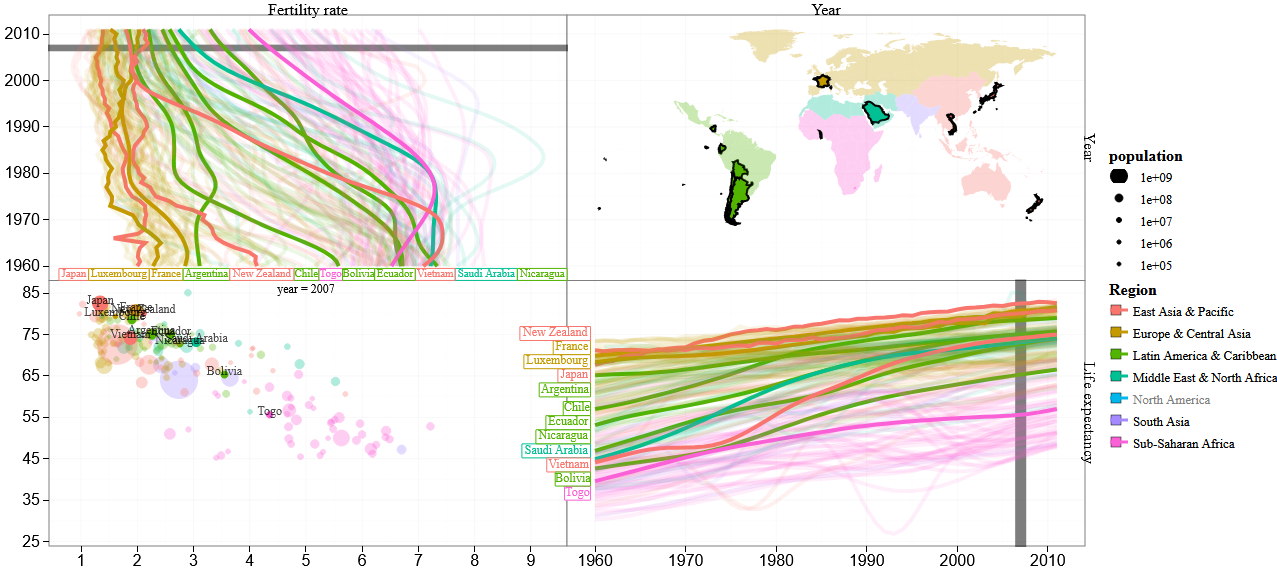
Another key feature added this week was the ability to hide the rectangular background behind the label. In response to mentor feedback asking whether borders could be disabled, I introduced a new argument: background_rect = TRUE/FALSE. When set to FALSE, no <rect> is drawn behind the text. This gives users more control over the appearance of label elements. I also added a live example of this to the worldbank-facets-map.R visualization.
Labels without background rect using background_rect = FALSE
geom_label_aligned uses quadratic programming (QP) to avoid collisions, but only within label groups. The grouping is based on whether labels lie at "similar" positions on the axis perpendicular to alignment (e.g., y-axis for horizontal alignment). This similarity is determined using label height (or width) as a threshold, so that labels with overlapping or near-overlapping positions get grouped.
While this works well in many cases, it can lead to over-grouping in cases where slight overlaps on the perpendicular axis shouldn’t trigger alignment optimization. I created test cases and visualizations to explore alternative grouping strategies:
- Exact-position grouping: Only group labels that lie on exactly the same y (or x) value.
- Reduced-threshold grouping: Group labels that are very close in position, but using a smaller similarity threshold than full label size.
Links
Week 7
July 14 – July 20, 2025
Smooth transitions and perfect alignment — finally achieved!
Outcome
This week was one of the most fulfilling milestones of my GSoC journey so far — my long-awaited geom_label_aligned pull request was finally merged! After weeks of constant iteration, design discussions, testing edge cases, and refining visual behavior, it’s now part of the main animint2 codebase. 🎉
Even more exciting, I officially cleared my GSoC midterm evaluation. My mentor's feedback was incredibly uplifting.
What I Worked On
-
Fixed confusing vertical alignment logic: The label vertical alignment was originally unintuitive — setting
vjust = 1actually placed the label at the top, and 0 at the bottom, which felt reversed. I restructured the logic to use1 - get_vjust(d), flipping the behavior so it’s now natural and aligns labels as expected. - Resolved label transition glitches: Previously, when new labels appeared in the plot, they awkwardly flew in from the corner of the SVG canvas. This happened because the transition animations applied uniformly, even to new elements. I fixed this by ensuring transitions only run for elements that existed in the previous state. This made animations feel buttery-smooth and visually correct.
-
Made label spacing more reliable: I added a test to check that all aligned labels maintain at least 3px vertical spacing. It computes gaps between label bounding boxes. This guarantees our label layout stays readable and clutter-free:
expect_true(all(gaps >= 3), info = paste("Min gap found:", min(gaps))) -
Polished and hardened tests: My mentor rightly pointed out that using
length(rx)(i.e., computed length) in a test is fragile. I replaced it with a literal value that reflects the actual number of expected labels, making the test stricter and more future-proof:expect_equal(as.numeric(rx), rep(5, 12)) -
Experimented with label centering offsets: I noticed that SVG
getBBox()often gives bounding boxes that include font descenders (like in the letter ‘g’), which made some labels appear slightly off-center. I manually experimented with offsetting theyposition using+ d.size / 3to visually balance it. This is not a perfect fix, hence this idea was dropped for now, to keep the code simple.
✅ Midterm Evaluation Passed
I had my midterm evaluation this week, and Im super happy to share that it went really well. The appreciation form my mentor was incredibly encouraging.
The PR that was merged: PR #203 - geom_label_aligned
Whats Next?
Ill now be diving into Issue #211, which is about combining the renderer and compiler tests. I need to see i that is even beneficial or not. Currently, the R code coverage is tracked from compiler tests and JS code coverage from rednderer tests.
🔗 Links
Week 8
July 21 – July 27, 2025
Outcome
This week I successfully merged PR #212, which implemented a consolidated testing workflow combining compiler and renderer test suites. This resolved Issue #211 and partially addressed Issue #210. The restructured setup increased R coverage by ~4% while maintaining JS coverage, and significantly improved test reporting structure and maintainability.
What I Worked On
-
Combined compiler and renderer test execution: Updated
tests/testthat.Rto call both renderer and compiler tests in the same session. Previously, only compiler-side tests were run withcovr::package_coverage(), so renderer-related R code was excluded from R coverage. -
Restructured GitHub Actions: Split test workflows into two separate CI jobs:
- JS_COVERAGE: Executes full test suite (compiler + renderer) in a Chromote-enabled session to collect JavaScript coverage.
-
R_COVERAGE: Runs the same test suite under
covr::package_coverage()to collect R coverage across both test types.
-
Addressed workflow time tradeoffs: Although the new setup adds ~5 minutes to the workflow, it removes redundant test runs (previously tests were run once normally and once again via covr) and ensures all R code is accounted for. I also removed legacy test files (
test-tt-inter.R) that were causing conflicts or duplicating logic. -
Investigated merging both coverages into one job: This was technically infeasible.
covrinstruments the package into a temp directory which breaks how Chromote serves test content, leading to broken JS coverage collection. So I opted for clean separation of coverage concerns into two dedicated jobs. - Contributed to related efforts: Reviewed PR #209 on migrating RSelenium to Chromote-based shiny tests and discussed implications of deprecated test files and restructuring.
Learnings
- How
covr::package_coverage()builds instrumented environments and how that interferes with browser-based test frameworks. - Effective use of separate CI jobs to isolate concerns without duplicating entire test runtimes.
- Workflow optimizations in GitHub Actions: using matrix jobs, conditional steps, and flags to fine-tune resource allocation and caching.
Confusions
-
Initially unsure why test output wasn’t printing in CI when using
covr::package_coverage(). Eventually traced this to the lack of real-time logging in instrumented sessions. -
Whether we could safely replace
tests_run(filter = ...)with a plaintests_run(). Determined that certain files liketest-tt-inter.Rwere failing or outdated, so better to exclude them until fixed.
Next Week Targets
- Add detailed documentation to animint2 wiki explaining how coverage is collected across R and JS codebases.
- Start working on fixing Issue #213 – the
geom_ablineproblem with unnecessary ticks on infinite lines.
🔗 Links
Week 9
July 28 – August 3, 2025
Outcome
This week, I collaborated on PR #209 to help integrate shiny-based renderer tests using ChromoteSession. I also authored two wiki articles to document the updated coverage architecture in our GitHub Actions workflow. In parallel, I began working on PR #214, addressing the geom_abline clipping issue during axis rescaling.
What I Did
-
Contributed feedback and suggestions on PR #209 to help resolve persistent test warnings in
test-shiny.Rinvolving random ports and unexpected session behavior. -
Proposed reuse of
tests_init()andtests_run()to unify Shiny and non-Shiny tests under a sharedChromoteSession. This change helped simplify test session initialization and eliminated the need for redundantChromoteSession$new()calls within each test. -
Investigated warnings like
localhost:3147 cannot be openedand recommended switching from random to fixed ports to ensure consistent test behavior across CI and local environments. - Authored two wiki articles to support future contributors:
-
Started working on PR #214 to fix the
geom_ablineplot clipping issue reported in Issue #142. Implemented a prototype fix in JavaScript that recalculates line endpoints using the updated scale domains after axis changes.
Learnings
-
Gained deeper insight into how
ChromoteSessioninteracts with Shiny applications and how separate servers (viastart_shiny_app(),start_rmd_app()) complicate centralized test orchestration. -
Learned that Shiny tests require dedicated ports and separate server instances, which cannot be reliably managed via
tests_init()alone without architectural adjustments. -
Understood how R-side preprocessing in
GeomAblinefails to apply afterupdate_axes()due to missing clipping logic in the renderer, prompting a need for JS-side endpoint recalculation.
Confusions
-
Unsure whether reusing the same
ChromoteSessionacross compiler, renderer, and Shiny tests might cause state conflicts — requires further validation with more complex test scenarios. - Open architectural question: Should geometric preprocessing logic for clipping live entirely in the renderer or be shared between compiler and renderer layers?
Next Week Targets
- Test the
geom_ablineclipping fix across variousupdate_axes()scenarios using real-world plots and new renderer tests. - Write a failing renderer test to replicate the bug in Issue #142 and verify that the fix in PR #214 resolves it without regression.
- Begin cleanup and de-duplication of old R-side clipping logic if the JS implementation proves robust.
🔗 Links
Week 10
August 4 – August 10, 2025
Outcome
This week, I focused on finalizing PR #214 to resolve the geom_abline clipping issue when update_axes() is applied. The fix successfully keeps ablines within plot bounds, but introduced a slope discrepancy that I am currently investigating. I also investigated Issue #216, where the year selection menu disappeared in the World Bank data viz, and identified both a workaround and a likely cause.
What I Did
-
Completed the shift of
geom_ablineclipping logic from the R (compiler) side to the JavaScript (renderer) side in PR #214. This ensures lines are clipped correctly afterupdate_axes()changes the view limits. - Added a dedicated renderer test to confirm that ablines remain within bounds after axis updates.
- Discovered a slope difference in the plotted ablines after the renderer-side change and began investigating the cause.
- Looked into Issue #216 and reproduced the missing year selection menu bug in the World Bank visualization.
-
Found that placing
make_tallrect()above thegeom_text()in the scatterplot restores the year selector.
Learnings
- Confirmed that moving geometric calculations to the renderer allows for dynamic clipping after plot updates, but also makes visual output dependent on JavaScript-side numeric precision and logic.
-
Learned that the
is.variable.valueproperty can suppress selection menus when the first encountered geom for a selection variable uses namedclickSelects/showSelected. - Understood that the geom ordering in plot definitions can unintentionally affect UI elements due to this selector logic.
Confusions
-
Still unsure why the renderer-side computation for
geom_ablineresults in different slopes compared to the compiler-side logic. - Need to verify whether changing selector default logic will have unintended side effects on other visualizations.
Next Week Targets
- Resolve the slope discrepancy in the
geom_ablinerenderer-side implementation. - Push a test case for the year selection menu bug in Issue #216.
- Implement a fix for selector logic so that
selectizedefaults consider all geoms for a given variable.
🔗 Links
Week 11
August 11 – August 17, 2025
Outcome
This week, I completed the geom_abline fix, ensuring lines are clipped correctly even after update_axes() changes.
I also restored compiler-side computations for static plots, which resolved the failing CRAN tests, and verified the correctness of the
changepoint detection example. The updated plot now renders ablines neatly within plot boundaries.
fixed geom_abline bug
What I Did
-
Finalized the
geom_ablinefix and confirmed that slope discrepancies are resolved. -
Added a dedicated renderer test to demonstrate that ablines remain within plot boundaries after
update_axes(). -
Fixed the CRAN test failures by restoring
x,xend,y, andyendcomputations on the compiler side for static plots. - Corrected the geom_abline changepoint detection example, where ablines now stay properly clipped inside the plotting area.
- Prepared the corrected changepoint detection plot for inclusion in the gallery.
Learnings
- Confirmed the need to retain compiler-side computations for static plots, since renderer-only logic isn’t sufficient for non-interactive outputs.
- Understood how combining compiler- and renderer-side logic ensures consistency across static and interactive visualizations.
-
Learned that comprehensive renderer tests are valuable for guarding against regressions after
update_axes()operations.
Confusions
- No major confusions this week; main challenges were in diagnosing why CRAN tests were failing for static plots.
Next Week Targets
- Investigate Issue #216, where the year selection menu no longer appears in the World Bank visualization, and implement a fix as suggested by my mentor.
🔗 Links
Week 12
August 17 – August 23, 2025
Outcome
This week felt like a culmination of my work on the geom_abline feature. I focused on polishing the PR, streamlining the code, and making it more professional and maintainable. The changepoint detection example that once extended beyond plot boundaries now renders perfectly within the axes, and I finally added it to the gallery as a port of the 22nd visualization. Seeing it integrated in the gallery was incredibly satisfying , a tangible result of weeks of effort.
What I Did
I spent most of the week cleaning up the geom_abline code. I removed redundant computations, improved readability, and ensured the logic for static plots remained correct. Once the code was polished, I updated the gallery example so that the ablines now stay entirely within plot boundaries. It was rewarding to see the visualization render exactly as intended. You can see the preview here: Gallery Preview.
Learnings
Beyond the technical aspects, I realized how important code style and readability are, especially for features that others will use and maintain. Small improvements — like removing redundancy, consistent naming, and clear logic — make a huge difference in the long run. It also reinforced the value of thorough testing for both interactive and static plots.
Reflections
As the final week of GSoC approaches, I feel a strong sense of accomplishment. Resolving tricky bugs, building robust examples, and seeing my work integrated into the gallery has been incredibly fulfilling. The journey from identifying issues like clipping in geom_abline to fully implementing and testing them in both interactive and static contexts has been challenging, but immensely rewarding.
🔗 Links
Week 13
August 24 - August 30, 2025
Outcome
🎉 Successfully wrapped up my Google Summer of Code journey with animint2! Completed all planned contributions, finalized documentation, and ensured key features and bug fixes were merged into the library.
What I did
- Finalized and tested
geom_label_aligned, a new optimization-based labeling feature now part ofanimint2. - Completed the unified R + JavaScript coverage pipeline, ensuring reliable test coverage across compiler and renderer.
- Documented coverage workflows and Codecov integration in project wikis.
- Fixed critical rendering issues like the
geom_ablineclipping bug. - Implemented D3-powered tooltips, improving interactivity and scalability of dashboards.
-
Fixed an issue where tooltips containing newline characters (e.g.
"two\nlines") caused rendering failures when combined with other aesthetics such asaes(color=...). The problem was due to TSV export withquote=FALSE, which broke parsing when fields contained newlines. The TSV writer now usesquote="auto", ensuring fields with\nare preserved correctly. On the rendering side, newline characters in tooltips are converted to<br>, so multi-line tooltips are now properly supported. - Reviewed and checked open PRs (including Rselenium workflows) for stability and readiness.
Learnings
Gained deep technical experience in bridging R and JavaScript for large-scale interactive visualizations, debugging across compiler/renderer layers, and writing maintainable, professional open-source code.
Confusions
No confusions this week — just wrapping things up and celebrating completion 🚀
Next Week Targets
Plan to continue contributing to animint2 beyond GSoC, polishing features and exploring new ideas for interactive data visualization.